FIGURE 8.
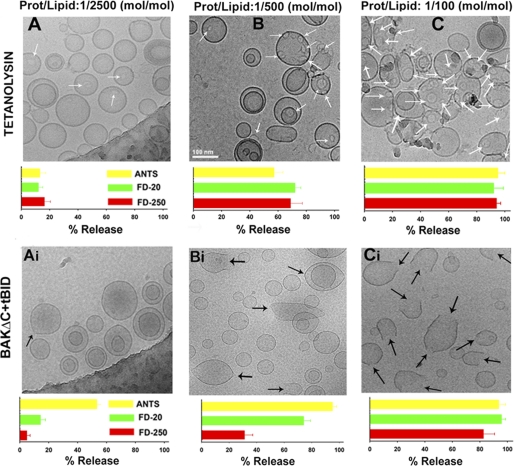
tBID-activated BAKΔC and tetanolysin-permeabilized LUVs via different mechanisms as assessed by cryo-EM and vesicular marker release assays. A–C, top, typical cryo-EM images of 50PC/50CHOL LUV were treated with tetanolysin at the indicated protein/lipid ratios. White arrows indicate ring-shaped structures corresponding to the oligomeric tetanolysin channel. The same scale indicated in the panel B was used in all images. Bottom, release of liposome encapsulated fluorophores of various sizes was assessed by gel filtration chromatography on CL2B-Sepharose column under the conditions corresponding to the images on the top. Data correspond to the mean and S.E. of 3 independent measurements (except protein/lipid 1:100 mol/mol, n = 2). Ai–Ci, top, typical cryo-EM images of 25PC/35PE/10PI/30CL LUV treated with BAKΔC plus tBID (1 μm) at the indicated BAKΔC/lipid ratios. Black arrows indicate LUV-containing distortions in the membrane. The same scale indicated in panel B was used in all images. Bottom, release of liposome encapsulated fluorophores of various sizes was assessed by gel filtration chromatography on CL2B-Sepharose column under conditions corresponding to the images on the top. Data correspond to the mean and S.E. of 3–5 independent samples. In all cases, liposome concentration was 1 mm.

