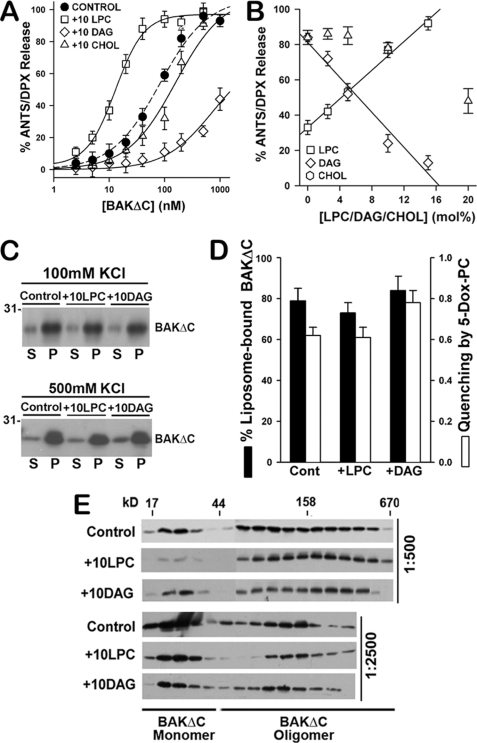
FIGURE 9.
LPC and DAG modulate BAKΔC-mediated LUV permeabilization. A, extents of vesicular ANTS/DPX release obtained upon incubation of increasing concentrations of BAKΔC plus tBID (100 nm) with CL-enriched MOM-like LUV of the following lipid compositions is shown: 25PC/35PE/30CL/10PI (30CL Lipos.), 20PC/30PE/30CL/10PI/10LPC (+10LPC), 20PC/30PE/30CL/10PI/10DAG (+10DAG), and 20PC/30PE/30CL/10PI/20CHOL (+10CHOL). Experimental data were fitted with a sigmoidal dose-response nonlinear regression model with Sigma Plot software to estimate the concentration of BAKΔC where 50% of the ANTS/DPX leaked out (EC50 values): Control LUV = 82.3 ± 7.4 nm; 10LPC LUV = 14.8 ± 2.4 nm; 20CHOL LUV = 174.4 ± 23.9 nm; 10DAG LUV = 739.3 ± 29.7 nm. Data represent the mean values and S.E. from at least two independent experiments. B, dose dependence of the effect elicited by LPC, DAG, and CHOL on the vesicular ANTS release induced by BAKΔC plus tBID is shown. Continuous and dashed lines represent least-square linear fits to the plots of extents of vesicular ANTS/DPX release versus molar percent of LPC (R2 = 0.97) and DAG (R2 = 0.95), respectively. Data represent the mean values and S.E. of 2–5 independent experiments. C, BAKΔC binding to liposomes of the indicated lipid composition assessed as explained in Fig. 2B is shown. S, supernatant; P, pellet. D, a comparison of the effects exerted by LPC and DAG on BAKΔC:liposome association in 500 mm KCl buffer and on the degree of quenching of BAKΔC tryptophan fluorescence intensity by 5-doxyl-PC is shown. Data represent the mean values and S.E. of at least two independent experiments. E, shown is the effect of LPC and DAG on tBID-activated BAKΔC oligomeric status assessed by gel filtration chromatography on Superdex 200 column as explained in Fig. 2C. BAKΔC was incubated with LUVs at protein:lipid ratios, indicated at the right of the immunoblots.

