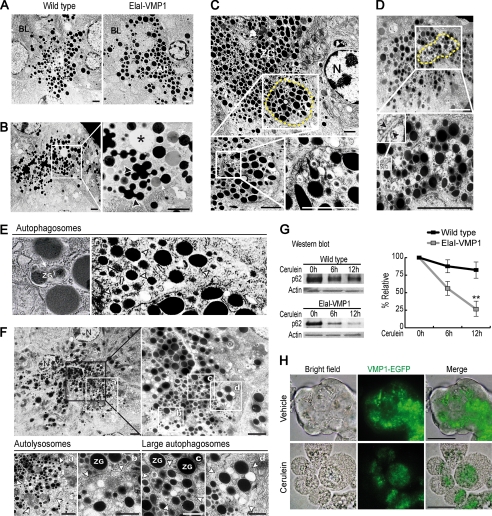
FIGURE 1.
Hyperstimulation of CCK-R in acinar cells induces the redistribution of zymogen granules and VMP1-containing autophagosomes. A–F, transmission electron microscopy of pancreatic tissue. A, wild type and ElaI-VMP1 mouse pancreata. No ultrastructural alteration is evident in zymogen granules of acinar cells from ElaI-VMP1 compared with wild type mouse pancreata. B, wild type mouse pancreas after CCK-R hyperstimulation (detailed on the right). Ultrastructural alterations of zymogen granules (arrowheads), fusion between zymogen granules and condensing vacuoles (arrow), and zymogen granules appearing near basolateral dilated space are shown (*). C–F, ultrastructure of pancreatic tissue from ElaI-VMP1 mice after CCK-R hyperstimulation with cerulein. C and D, autophagosomes containing zymogen granules are observed in the apical area of the acinar cell (dashed line). Zymogen granules inside autophagosomes are detailed in C (bottom panel). Autophagosome-double membrane is detailed in D, bottom panel (arrowhead). E, left panel, example of zymogen granules sequestered by autophagosome (arrow). Right panel, examples of autophagosomes containing one single zymogen granule (arrowheads). F, examples of large autophagosomes and autolysosomes containing zymogen granules. Higher magnification is shown on the right upper panel. At the bottom panel, the arrowheads show the limits of the single membrane autolysosomes (panels a and b) and large double membrane-limited autophagosomes (panels c and d). G, Western blot analysis and densitometry quantification of p62 in ElaI-VMP1 mouse pancreas homogenates shows the progressive reduction of the p62 signal evidencing autophagic flow in pancreas from transgenic mice under CCK-R hyperstimulation with cerulein (**, p < 0.001 versus wild type). H, bright field, VMP1-EGFP fluorescence and merge images of isolated ElaI-VMP1 pancreatic acini. VMP1-EGFP fluorescence is located in the basal region of untreated acini (upper panel). After 1 h of CCK-R hyperstimulation with cerulein, VMP1-EGFP relocated to the granular area of acinar cells (bottom panel). Results are representative of at least three independent experiments. Scale bars, 4 μm (A–F), and 10 μm (H). BL, basolateral, AP, apical, ZG, zymogen granules. N, nucleus.

