FIGURE 3.
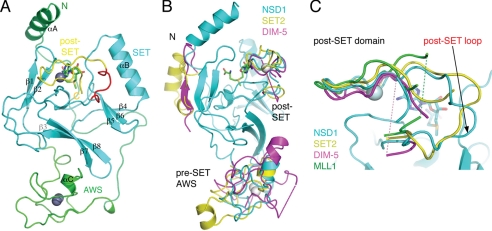
Structure of NSD1-CD. A, a ribbon representation of the overall structure. Different segments of the protein are colored following the coloring scheme in Fig. 1A. The AdoMet molecule is shown as a stick model (green, carbon; blue, nitrogen; red, oxygen). Zinc ions are shown as gray spheres. Secondary structure elements and the protein termini are labeled. B, superposition of NSD1 (cyan), SET2 (yellow; PDB id: 3H6L) and Dim-5 (magenta; PDB id: 1PEG) structures. The SET domains are highly similar, and for clarity, only the NSD1 SET domain is shown. Dashed lines indicate structurally disordered regions. C, superposition of the post-SET domains of NSD1, SET2, Dim-5, and MLL1 (PDB id: 2W5Y). The magenta and green dashed lines indicate the disordered loop segments of Dim-5 and MLL1, respectively.

