FIGURE 4.
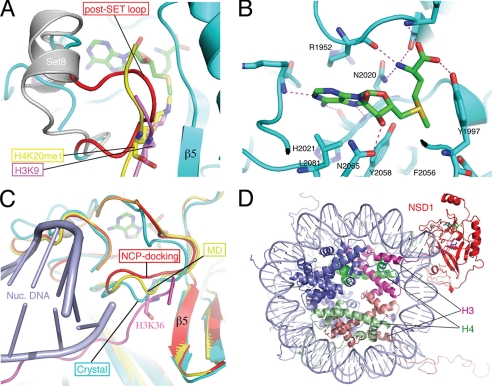
Structure of the active site and modeling of substrate binding. A, the post-SET loop of NSD1 occludes substrate binding. The H3K9 peptide (magenta) bound to Dim-5 and the H4K20me1 peptide (yellow) bound to Pr-Set7/Set8 (gray; PDB id: 2BQZ) are superimposed with the NSD1-CD structure. For clarity, the structure of Dim-5 is not shown, and only the post-SET domain of Pr-Set7/Set8 is shown. The loop colored in red represents the post-SET loop of NSD1-CD, and the rest of the protein structure is colored cyan. AdoMet is shown as a stick model (green, carbon; blue, nitrogen; red, oxygen), as are H3K9 (magenta, carbon) and H4K20me1 (yellow, carbon). B, amino acids surrounding the AdoMet molecule and their interactions with AdoMet. C, conformational dynamics of the post-SET loop. The post-SET loops from the crystal structure (cyan), from the molecular dynamics simulation at 276 ps (yellow), and from an energy-minimized model of nucleosome docking (red) are superimposed. The docked H3 tail and nucleosomal DNA are shown in magenta and light blue, respectively. H3K36 is shown as a stick model. Note that in the docked model, the post-SET domain contacts DNA. D, a global view of the modeled NSD1-CD complex with a nucleosome core particle. NSD1-CD is shown in red; two H3 molecules are shown in magenta and salmon; two H4 molecules are shown in green and light green; and H2A and H2B are shown in blue, and DNA is shown in light blue.

