FIGURE 1.
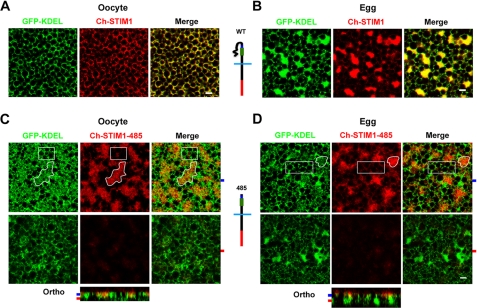
STIM1-485 disrupts ER structure. A, oocytes were injected with STIM1 (10 ng) and GFP-KDEL (5 ng) RNAs and allowed to express for 2 days. Confocal images taken deep into the cytosol show clear co-localization between the ER marker (GFP-KDEL) and STIM1. Note the reticular appearance of the ER in oocytes. B, cells were injected as described for A and then treated with progesterone to induce oocyte maturation. Eggs arrested at metaphase II of meiosis were imaged and exhibit remodeling of the ER into large patches as observed by the concurrent STIM1 and GFP-KDEL distribution. A schematic representation of the mCherry-tagged wild-type STIM1 is shown, with the SOAR/CAD domain in green, the SHD in blue, and mCherry in red. C and D, oocytes were injected with Ch-STIM1-485 (10 ng) and GFP-KDEL (5 ng) and imaged as oocytes (C) or after maturation as eggs (D). A schematic representation of Ch-STIM1-485 is also shown. Orthogonal sections (Ortho) through the z-stack of images are shown in addition to images from different focal planes, as indicated by the matching color-coded tabs to the left of the orthogonal sections. Areas of the ER that are enriched with STIM1-485 (irregular white shape, for example) show disruption of the typical reticular structure (GFP-KDEL panels), whereas areas of the ER with little STIM1-485 accumulation exhibit the normal reticular structure (white boxes). This is true in both oocytes (C) and eggs (D). Scale bars = 2 μm.

