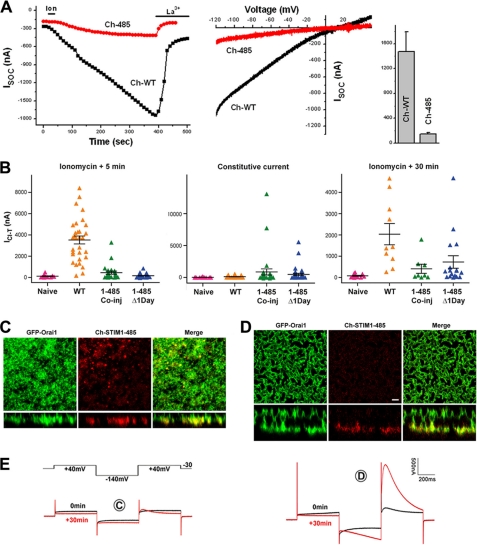
FIGURE 4.
STIM1-485 is ineffective in supporting SOCE. A, ISOC from oocytes expressing mCherry-tagged wild-type STIM1 (Ch-WT) or Ch-STIM1-485 (Ch-485). ISOC development over time, current-voltage relationships, and current amplitude (means ± S.E.) are shown (n = 5–6). B, the ICl-T was used as a readout for SOCE. See “Experimental Procedures” for additional details on ICl-T. ICl-T was measured from uninjected oocytes (Naive), oocytes injected with Orai1 plus Ch-STIM1 (WT), oocytes injected with Orai1 plus STIM1-485 (1–485 Co-inj), and oocytes that were allowed to express Orai1 for 1 day before STIM1-485 injection (1–485 Δ1Day). Shown are the currents at 5 min after store depletion with ionomycin, the constitutive ICl-T before store depletion, and 30 min after store depletion as indicated at the top of each panel. Data are presented as a scatter plot with means ± S.E. (n = 12–40). C–E, confocal images and matching current traces (E) from two representative oocytes with a small (C) or large (D) ICl-T. ICl-T was calculated as the peak transient current at the second +40-mV pulse minus the current value at the end of the first +40-mV pulse as described previously (29). Scale bar, 2 μm.

