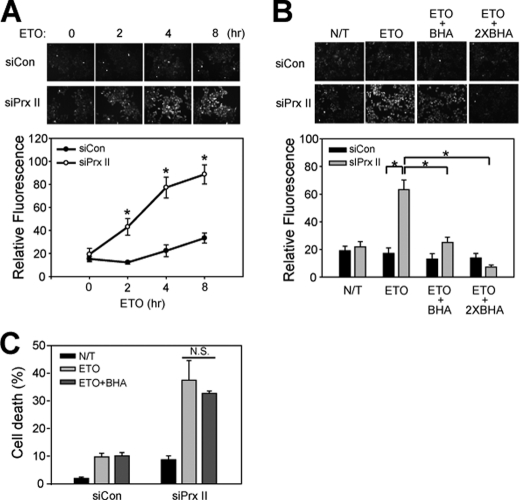
FIGURE 4.
Induction of cell death by etoposide is independent of ROS generation. A, measurement of ROS production in etoposide-treated HeLa cells. B, elimination of etoposide-induced ROS by BHA. Cells were pretreated with 100 or 200 μm BHA (two times) 1 h before etoposide (ETO) treatment. Data in the graph are means ± S.D. of 2′,7′-dichlorodihydrofluorescein fluorescence values calculated from about 20–30 cells (n = 3; *, p < 0.0001). Representative images are shown (upper panel). C, effect of BHA treatment on etoposide-induced cell death in HeLa cells that had been transfected with control or PrxII siRNA. Data in the graph are means ± S.D. of results from three independent death assays as done in Fig. 2 (N.S., not significant). N/T, not treated.

