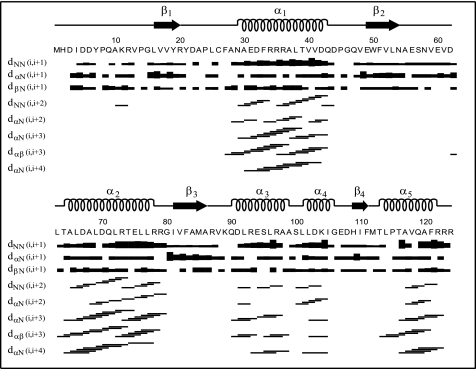
FIGURE 1.
Plot of sequential and medium range NOEs for Rv1739c STAS. NOEs are assigned in three-dimensional 13C- and 15N-edited NOESY-HSQC, and two-dimensional 1H-1H NOESY spectra of Rv1739c STAS. Bar thickness is proportional to NOE intensity. α-Helices are depicted as spirals. β-Sheets are depicted as arrows.

