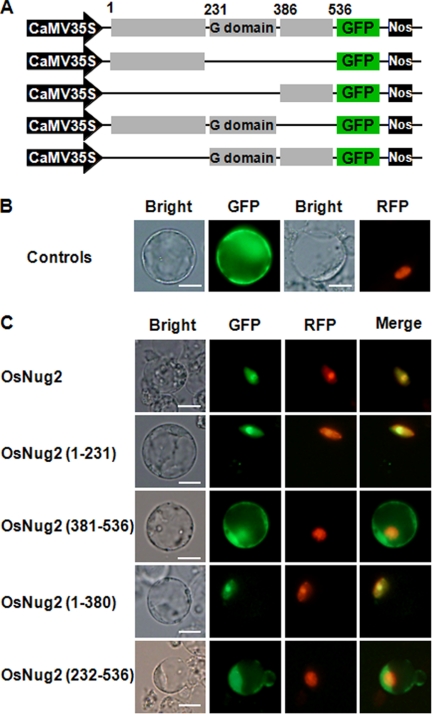
FIGURE 4.
Subcellular localization of OsNug2 deletion constructs. A, schematic representation of GFP-OsNug2 and deletion constructs. B, rice protoplasts were transformed with vectors expressing GFP or NLS-RFP. Cells were incubated for 36 h and then observed by fluorescence microscopy. The green GFP signal was observed in the cytosol (upper, second image) and the red NLS-RFP signal was observed in the nucleus (upper, fourth image). C, colocalization analysis of GFP-OsNug2 deletion mutants with NLS-RFP. The number of amino acid residues is indicated in parentheses at the left. Rice protoplasts were transformed with vectors expressing GFP-OsNug2 fusion proteins and NLS-RFP. Fluorescence microscopy was used to analyze colocalization between the GFP-OsNug2 deletion mutants and NLS-RFP. OsNug2(Full)-GFP, OsNug2(1–231)-GFP, and OsNug2(1–380)-GFP were targeted to nucleolar/nucleolus; however, OsNug2(381–536)-GFP and OsNug2(232–536)-GFP were located to the cytoplasm. GFP (green) and RFP (red) signals indicate localization of OsNug2 and NLS fusions, respectively. Merge represents an overlaid image and overlap of OsNug2 and NLS generates a yellow color. Bright indicates a bright-field image. The white bar represents 10 μm.

