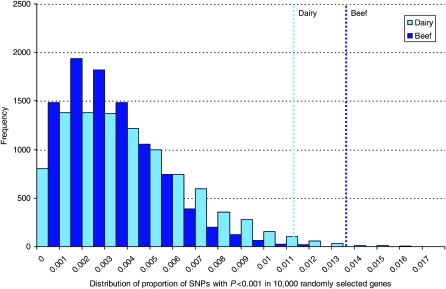
Figure 2.—
A frequency distribution of the proportion of SNPs with a P < 0.001 effect on stature in dairy and beef cattle data sets in 10,000 control tests. To make the tests comparable to the results reported in Figure 1, 55 genes were randomly selected from 16,850 bovine genes that were orthologs of human genes downloaded from BioMart (http://www.ensembl.org/biomart/index.html). The SNPs for the random control tests were in a 1-Mbp region centered on each of the 55 genes. The vertical lines represent the number of bovine SNPs with P < 0.001 association with stature in each data set. The percentage of control tests with an equivalent or greater proportion of significant SNPs associated with stature in the beef and dairy cow data was 0.19 and 0.38%, respectively. For each test, the number of SNPs significantly (P < 0.001) associated with stature was counted. The number of significant SNPs divided by the number of SNPs tested is represented along the x-axis.

