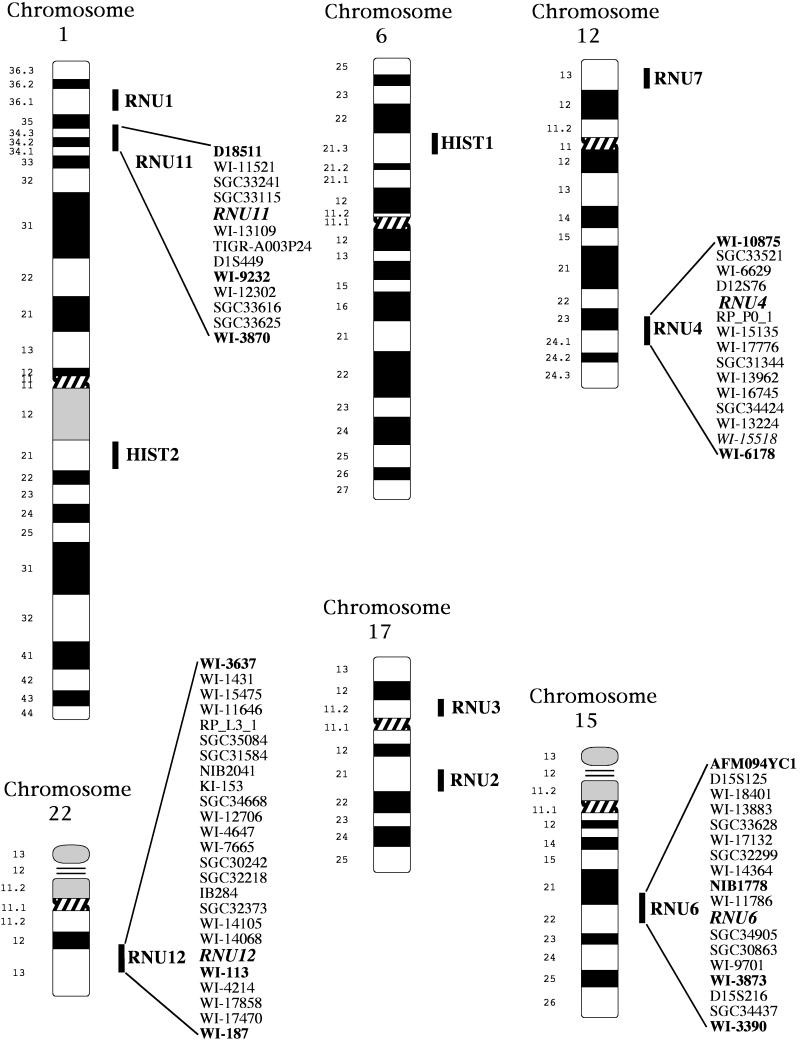
Figure 1.
Chromosomal locations of snRNA and histone genes used in this study. Map locations of the single-copy snRNA genes (determined by RH and cytogenetic mapping) as well as those of previously characterized snRNA and histone loci are shown. Bars to the right of the ideograms show the range of FISH signals. The nearest markers from the RH mapping are shown to the right of the chromsomes; MIT framework markers are shown in bold.

