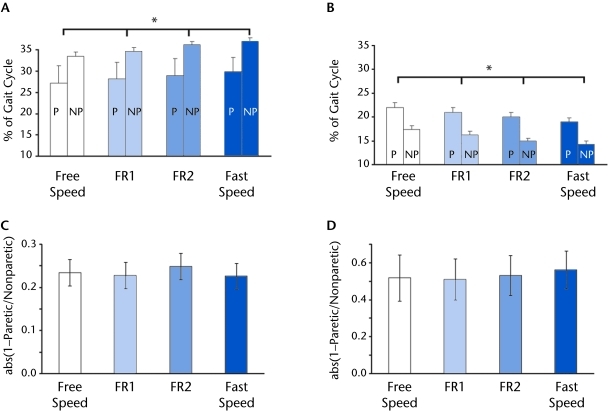
Figure 3.
Temporal gait parameters. (A) Paretic and nonparetic single-limb support time as a percentage of the gait cycle, averaged across all participants (N=20). (B) Paretic and nonparetic double-limb support time as a percentage of the gait cycle, averaged across all participants (N=20). (C) Single-limb support time symmetry across all speeds for all participants with step length asymmetry (n=15). (D) Double-limb support time symmetry across all speeds for all participants with step length asymmetry (n=12). Error bars represent ± standard error across participants. For all symmetry graphs, 0=perfect symmetry. FR1 and FR2 were intermediate speeds between free and fast speeds. P=paretic leg, NP=nonparetic leg. Asterisk indicates significant difference among speeds. “Abs” refers to absolute value of the quantity in the parentheses.

