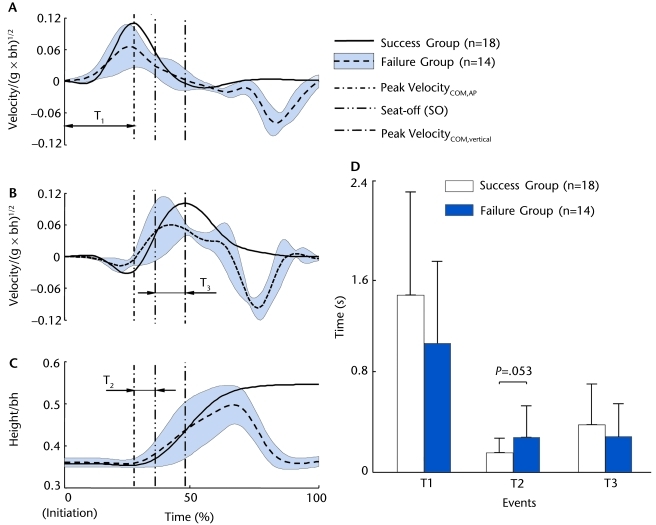
Figure 2.
Group mean of the time history of (A) anteroposterior (AP) velocity of the center of mass (COM) (VelocityCOM,AP), (B) the vertical COM velocity (VelocityCOM,vertical), and (C) the mid-hip point height from movement initiation to movement termination for the patients with Parkinson disease during the sit-to-stand (STS) task for the success group (solid line, n=18) and the failure group (dashed line, n=14). For the failed STS trials, the mean ± standard deviation across all 14 trials of the variables is shown. Also shown are the events of interest (vertical lines) for the STS task. They include the instant of peak VelocityCOM,AP, the instant of seat-off (SO), and the instant of peak VelocityCOM,vertical. The durations between movement initiation and the instant of peak VelocityCOM,AP (T1), between the instant of peak VelocityCOM,AP and SO (T2), and between SO and the instant of peak VelocityCOM,vertical (T3) also are listed. Both velocities are normalized to (g represents the gravitational acceleration, and bh represents the body height). The hip height is normalized to bh. (D) Means and standard deviations of T1, T2, and T3 for both success and failure groups.

