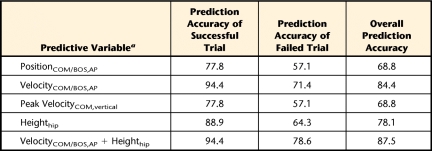
Table 2.
Prediction Accuracy (%) of the Sit-to-Stand Outcome (Success Versus Failure) Based on Each Predictive Variable Showing a Significant Difference Between Success and Failure Groups
a PositionCOM/BOS,AP=center of mass (COM) anteroposterior position relative to the base of support (BOS) at seat-off, VelocityCOM/BOS,AP=COM anteroposterior velocity relative to that of the BOS at seat-off, VelocityCOM,vertical=COM vertical velocity, Heighthip=hip height.

