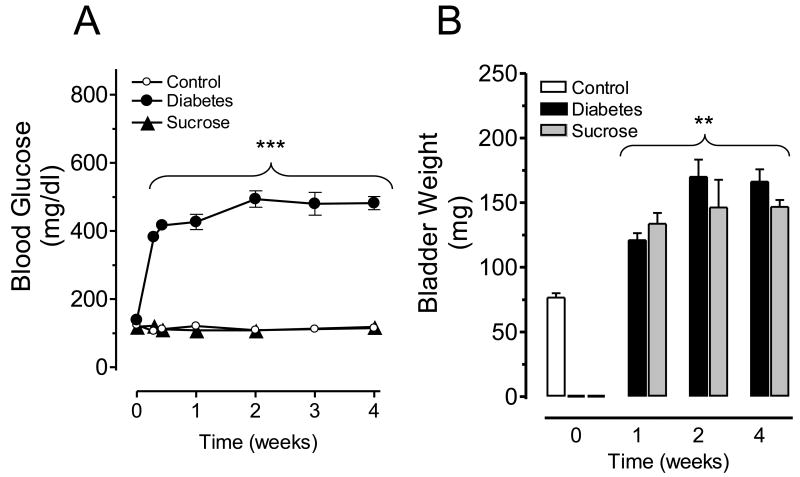
Figure 1.
Blood glucose levels (A) in control, diabetic or sucrose-fed rats during diabetes progression. Changes in urinary bladder weight (B) in control, diabetic or sucrose-fed rats during the early stages of diabetes. ***P<0.001, **P<0.01 vs. control group. Data represent means +/- S.E.M. from control (n=8), diabetic (n=10) and sucrose-fed (n=10) rats.

