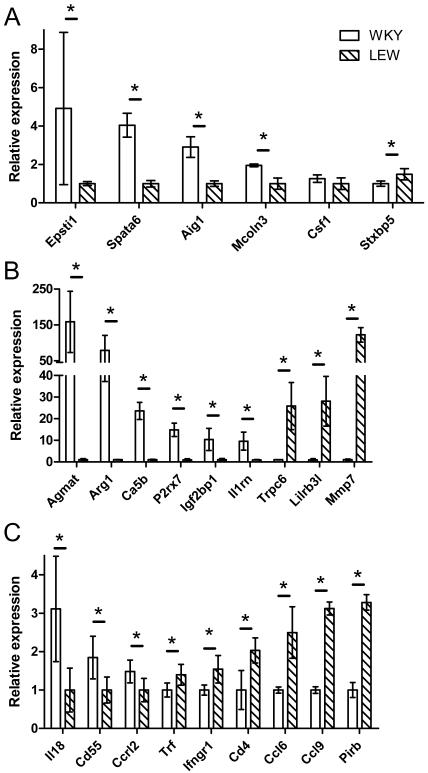
Figure 1. Validation of microarray data with quantitative PCR of selected differentially expressed genes.
A) positional differentially expressed QTL candidate genes; B and C) secondary effector genes. Relative gene expression was compared to Hprt for WKY and LEW basal macrophages. The secondary effector genes are presented in two separate graphs (B, C) according to scale of relative gene expression. All samples were amplified using an independent set of biological duplicates with three technical replicates per sample. * = p < 0.05 using a Mann-Whitney non-parametric test (one-tailed). Error bars represent standard deviation.

