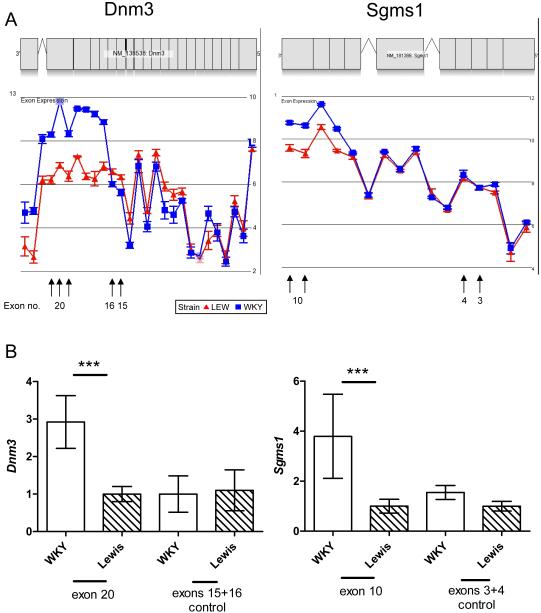
Figure 3. Comparison of alternative splicing microarray data predictions with quantitative PCR of selected transcript isoforms.
A) Microarray data showing increased expression of probe-sets that correspond to Dnm3 exons 17-21, in WKY basal macrophages and increased expression of probe-sets that correspond to Sgms1 exons 8-10, for WKY LPS-stimulated macrophages. Data is illustrated as a gene view plot showing mean log2 signal probe-set intensities by strain. Error bars represent standard errors. B) qPCR data confirming the microarray predictions. Relative expression, compared to Hprt, for WKY and LEW basal macrophages of Dnm3 exon 20 and control exons 15-16, together with WKY and LEW LPS-stimulated macrophages of Sgms1 exon 10 and control exons 3-4. All samples were amplified using an independent set of biological duplicates with three technical replicates per sample. ***P < 0.001, using a one-way ANOVA with Bonferonni’s correction. Error bars represent standard deviation.

