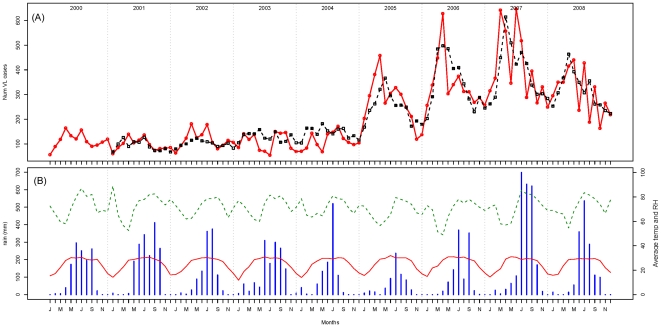
Figure 2. Observed and predicted VL cases and recorded meteorological parameters for each month from 2000 to 2008.
(A) The observed (solid red line) and the predicted (dashed line – estimated from the negative binomial model) numbers of monthly Visceral Leishmaniasis (VL) cases in Muzaffarpur district from 2000 to 2008. (B) Monthly rainfall in mm (blue histogram), average temperature (temp) in °C (solid red line) and average relative humidity (RH) in % (dashed green line).

