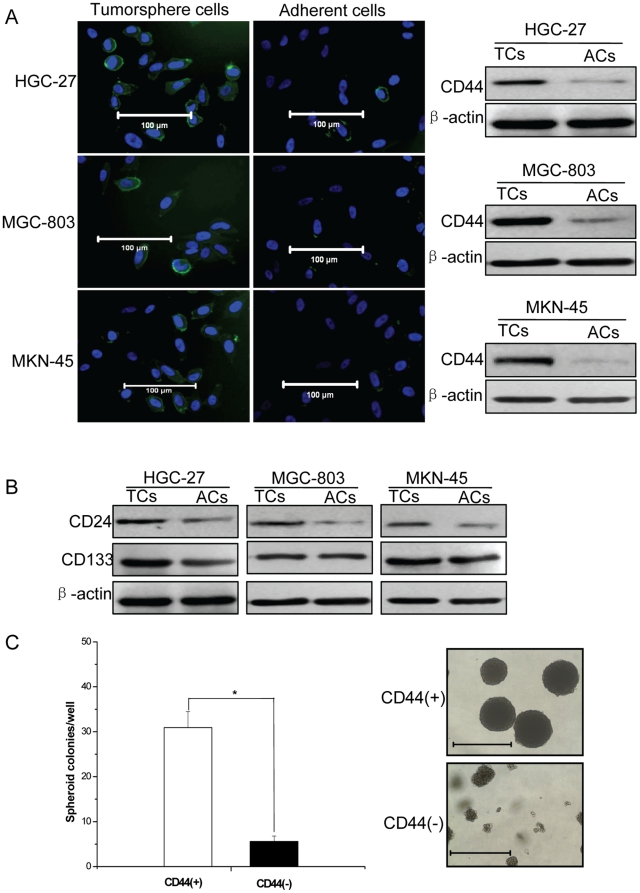
Figure 2. The expression of CSCs markers in tumorsphere cells and adherent cells.
(A) Immunofluorescence (left panel) and western blotting (right panel) analysis of CD44 (green color) on mechanically dissociated tumorsphere cells and adherent cells. Nuclei were counterstained by DAPI (blue color). TCs = tumorsphere cells, ACs = adherent cells. Bars = 100µm. (B) The expression of CD24 and CD133 in tumorsphere cells and adherent cells by western blotting, β-actin was provided as a control. (C) The tumorspheres formation capacity of HGC-27 CD44(+) cells and CD44(−) cells. * = P<0.05. Bars = 1000µm.

