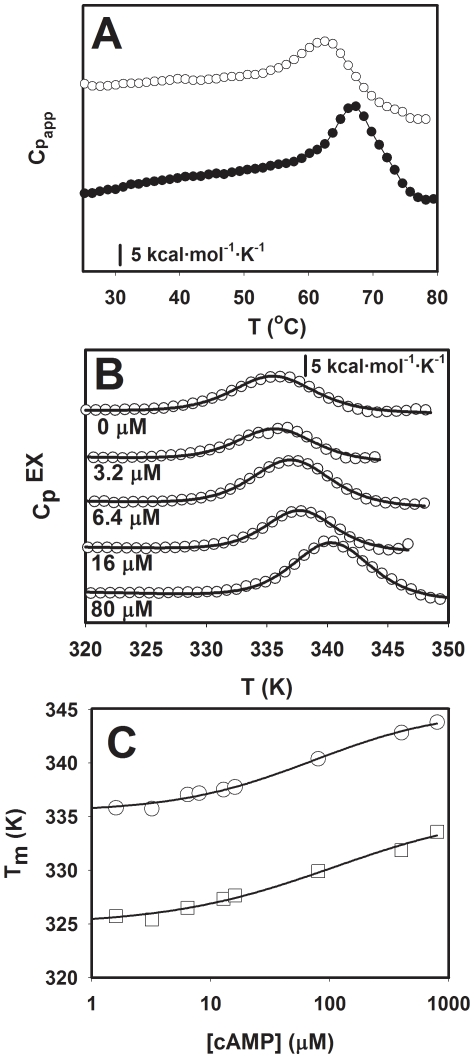
Figure 3. DSC analysis of RIα(92–381).
A) Profiles of apparent molar heat capacities (Cpapp) vs temperature (T) for RIα(92–381), in the apo state (○) and in the presence of a 10 fold molar excess of cAMP (•). B) Profiles of excess molar heat capacity (CpEX) after subtraction of the corresponding baselines for increasing cAMP concentrations. C) Dependence of the Tm value on cAMP concentration for RIα(92–381) (○) and G325D-RIα (92–381) (□). The apo-forms of both proteins were used for the titrations. Note that the scale is logarithmic and the lines are only to guide the eye.

