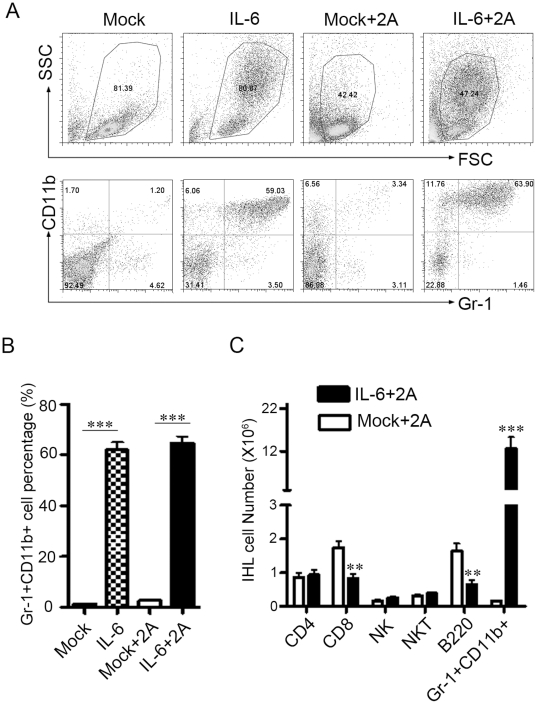
Figure 3. Gr1+CD11b+ myeloid cells are dramatically increased in the liver.
C57BL/6 mice were treated as in Figure. 1. At day 12 the intrahepatic leukocytes were isolated for FACS analysis. (A) Representative dot plots of Gr-1+CD11b+ cells in the liver. (B) The percentage of Gr-1+CD11b+ cells in intrahepatic leukocytes in all treated groups. (C) The number of CD4+ T cells, CD8+ T cells, NKT cells, NK cells, B cells, and Gr-1+CD11b+ cells in the liver of 2A treated mice. Three independent experiments were performed with similar results. **P<0.01, ***P<0.001 in comparison with control groups or groups as indicated.

