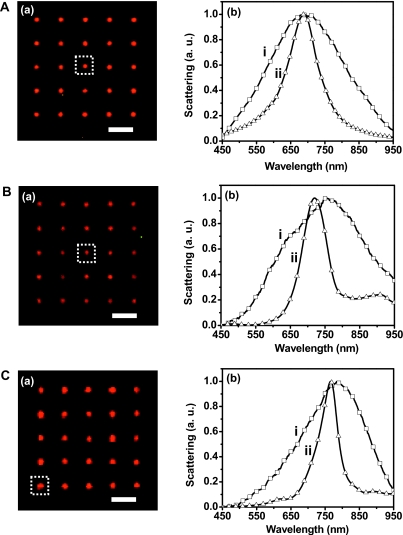
Figure 3.
Shape-dependent optical properties of single Ag NP using DFOMS and theoretical simulation. (a) Dark-field color images of Ag NP arrays in (A)–(C), which are the same arrays in Figs. 1a, 1b, 1c, respectively. (b) Normalized LSPR spectra of single Ag NP. These spectra were obtained from NPs shown in the insets of Fig. 1 and indicated by dotted squares in (a). The experimental measurements acquired by DFOMS are labeled as (i) while the DDA simulations are labeled as (ii). All scale bars are 3 μm. Note: single NPs in (a) are imaged under optical diffraction limit and thereby the scale bars in (a) show the distances among NPs, but not the sizes of NPs.

