Fig. 1.
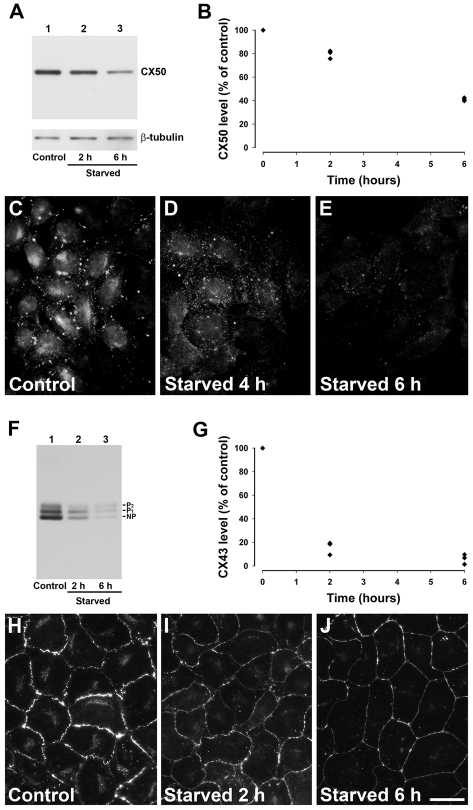
Starvation decreases levels of wild-type CX50 and CX43. (A) Immunoblot detection of CX50 and β-tubulin in aliquots of total homogenates from HeLa-CX50 cells that were kept under control conditions (lane 1) or starved for 2 or 6 hours (lanes 2 and 3). (B) Levels of CX50 detected after starvation expressed as a percentage of the levels detected in non-starved cells (from three independent experiments). (C–E) Distribution of anti-CX50 immunoreactivity in HeLa-CX50ind cells maintained under normal growth conditions (C) or starved for 4 or 6 hours (D and E, respectively). (F) Immunoblot detection of CX43 in aliquots of total homogenates from NRK cells incubated in normal growth medium (lane 1) or starved by incubation in HBSS for 2 or 6 hours (lanes 2 and 3). The migration positions of the different phosphorylated forms of CX43 (NP, P1 and P2) are indicated. (G) Levels of CX43 detected after starvation expressed as a percentage of control (from three independent experiments). (H–J) Distribution of anti-CX43 immunoreactivity in NRK cells incubated in normal growth medium (H) or starved by incubation in HBSS for 2 or 6 hours (I and J, respectively). Scale bar: 15 μm (C–E), 20 μm (H–J).

