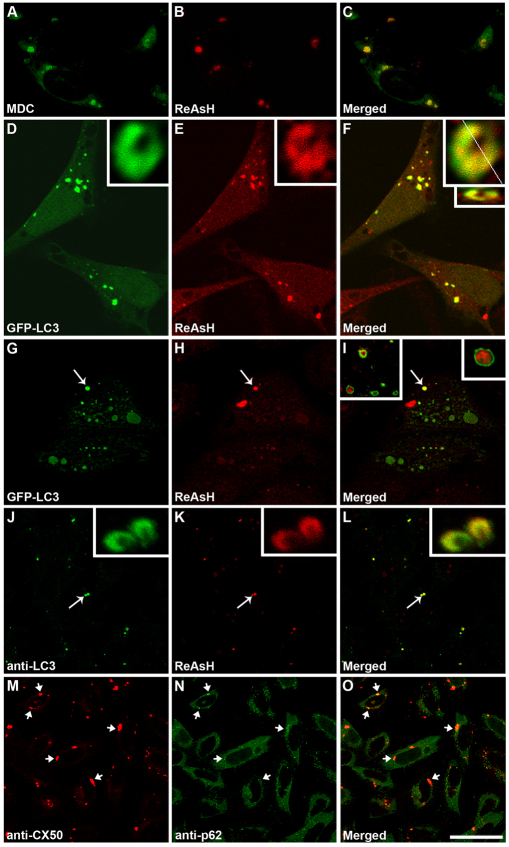
Fig. 9.
CX50P88S cytoplasmic accumulations colocalize with autophagosome markers and p62. (A–C) Photomicrographs of HeLa-CX50P88S(Cys)4 cells labeled with ReAsH and then with MDC (shown in green). (D–I) Confocal images of HeLa-CX50P88S(Cys)4 cells transiently transfected with a DNA construct coding for GFP–LC3 and labeled with ReAsH 48 hours after transfection. The insets in D–I show deconvolved images of accumulations labeled with GFP–LC3 and ReAsH. The smaller inset in F corresponds to an x–z profile of the z-series of confocal images through the accumulation volume at the level indicated by the white line in the larger inset above. The inset on the upper right corner of I shows the deconvolved image of the accumulation indicated by the arrow in G–I at higher magnification. The inset on the left shows other examples. (J–L) Confocal images of HeLa-CX50P88S(Cys)4 cells labeled with ReAsH and subjected to immunofluorescence using anti-LC3 antibodies. The accumulations indicated by the arrows are shown at higher magnification in the insets. (M–O) Confocal images of HeLa-CX50P88S show the localization of CX50P88S (M) and p62 (N) after double-label immunofluorescence using anti-CX50 and anti-p62 antibodies. The superposition of the two signals is shown in O. Arrows indicate colocalization of p62 with CX50P88S accumulations. Scale bar: 27 μm (A–C), 25 μm for (D–F), 1 μm (insets in D–F), 22 μm (G–I), 38 μm (J–L), 43 μm (M–O).

