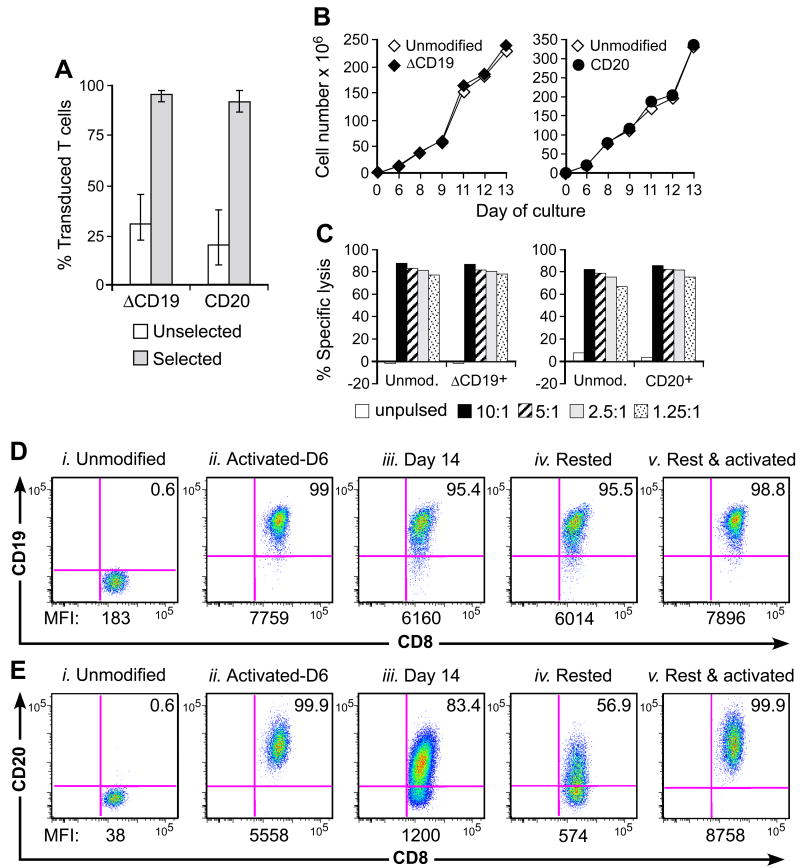
Fig. 3. Gene-marking of macaque CD8+ TE with non-immunogenic B-cell lineage marker.
(A) Efficient transduction and selection of macaque CD8+ TE with the ΔCD19 or CD20 marker. Macaque CD8+ TE were stimulated with anti-CD3/CD28 mAbs, transduced with ΔCD19 or CD20, and enriched by immunomagnetic selection. Aliquots of the unselected (□) or selected ( ) T cells were examined by flow cytometry after staining with mAbs against CD3, CD8, and CD19 or CD20 mAbs. Shown are mean and range of the results with the ΔCD19 (n=7) or CD20 (n=3) marker. (B) In vitro growth of gene-modified TE clones. Left panel: Representative TE clone either unmodified (◇) or ΔCD19+ (◆). Right panel: Representative TE clone either unmodified (◇) or CD20+ (●). Aliquots of T cells unmodified or transduced with ΔCD19+ (left panel) or CD20+ (right panel) were restimulated with anti-CD3/CD28 mAbs, irradiated feeder cells and IL-2, and numeric expansion was measured by counting viable cells on the indicated days. Data are representative of results with ΔCD19+ or CD20+ T cells obtained from each three macaques. (C) Gene-marked CMV-specific CD8+ TE clones retain CMV-specific reactivity. Aliquots of CMV-specific CD8+ TE either unmodified or either ΔCD19+ (left panel) and CD20+ (right panel) were restimulated in vitro and examined in a chromium release assay for recognition of autologous target cells, either unpulsed (□) or pulsed with the CMV cognate peptide at an effector-to-target (E/T) ratio of 10:1 (■), 5:1(
 ), 2.5:1 (
 ), or 1.25:1 (
 ). Data are representative of results with ΔCD19+ or CD20+ T cells from each three macaques. (D, E) Stability of the marker-gene expression in macaque CD8+ T cells. The ΔCD19+ (D) or CD20+ (E) T cells were stimulated with anti-CD3/CD28 mAbs and examined by flow cytometry on day 6 (ii) and 14 (iii) of the stimulation cycle for ΔCD19 or CD20 expression. Unmodified T cells served as negative control (i). Aliquots of T cells were also rested and the ΔCD19 or CD20 expression was assessed by flow cytometry after 4 weeks of rest (iv) or 6 days after restimulation with anti-CD3/CD28 mAbs (v). Inset values show the % of CD3+CD8+ T cells positive for ΔCD19 or CD20 and the MFI is indicated for each time point. Data showing the difference in the stability of expression of ΔCD19 and CD20 at the cell surface is representative for experiments with ΔCD19 and CD20-modified T cells from 3 animals, and was observed in eight ΔCD19+ and CD20+ TE clones.

