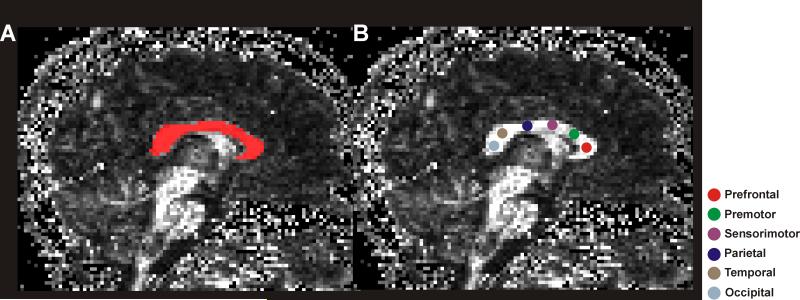
Figure 1.
Mid-sagittal view of fractional anisotropy maps with overlapped global and regional CC regions-of-interest. The left fractional anisotropy map (A) shows the global CC ROI (red), and the right fractional anisotropy map (B) shows regional ROIs of each CC segment. The colored circles, shown on different segments of the CC, are used for different CC fiber bundle assessment.

