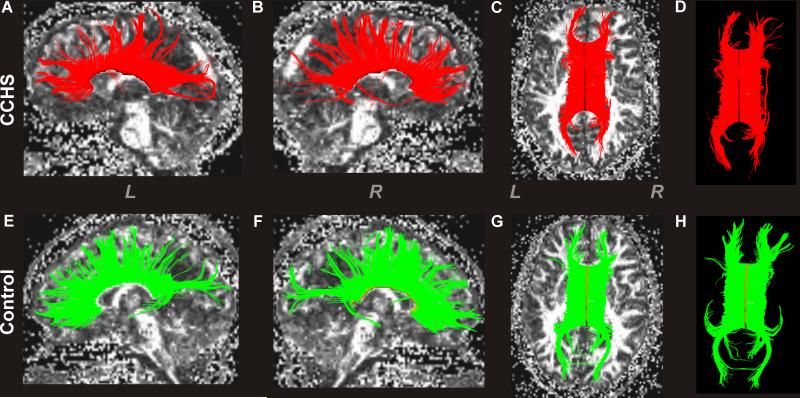
Figure 3.
Global CC fiber tracks and density in a CCHS and control subject. The upper panel shows left-side global CC fibers in a sagittal view (A), right-side fibers in sagittal view (B), and overall axial view of CC fibers, with (C) fractional anisotropy (FA) map in a CCHS subject (age, 22.6 years; female). The lower panel displays global left (E) and right-side (F) CC fibers in sagittal views, and overall view of those fibers with (G) background FA map in a control subject (age, 22.4 years; female). For better visualization of these fibers, images without background FA maps are displayed in the upper (D) and lower (H) panels. Overall, the CCHS subject showed reduced numbers and density of CC fibers relative to the control subject (CCHS vs. Control; fibers, 3990 vs. 4358; fiber density, 9.5 vs. 11.4 per mm2). (L = Left; R = Right)

