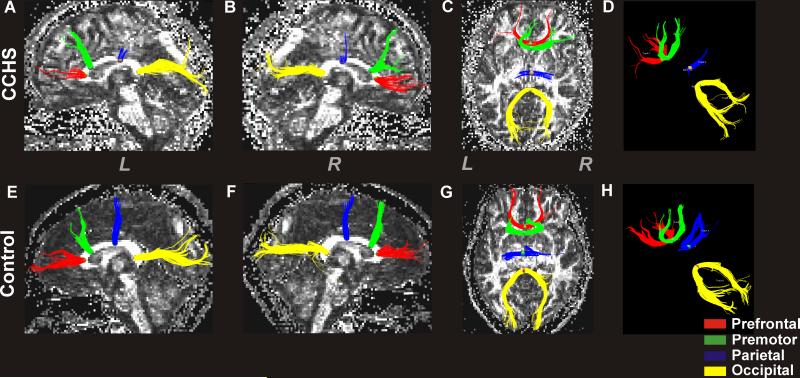
Figure 5.
Regional CC fiber tracks in a CCHS and control subject. The top panel shows left (A) and right-side (B) regional CC fibers that pass through a defined ROI in sagittal views, an overall view of fibers from the top in axial section (C) with a background fractional anisotropy (FA) map in a CCHS subject (age, 18.5 years; female). The lower panel shows left (E) and right-side (F) regional fibers in sagittal views, an overall view from above in axial section (G) with a background FA map in a control subject (age, 18.4 years; female). Images without background FA maps are also shown in upper (D) and lower (H) panels for better visualization of fibers. The CC regions that interconnect prefrontal, premotor, parietal, and occipital areas show reduced fibers in CCHS compared to the control subject (CCHS vs. control; prefrontal, 188 vs. 259; premotor, 166 vs. 251; parietal, 64 vs. 211; occipital, 374 vs. 437). (L = Left; R = Right)

