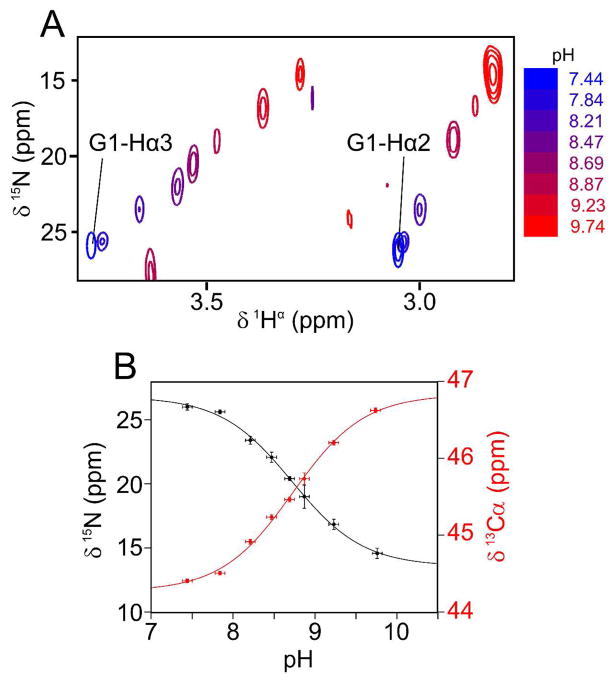
Figure 1.
pH titration of the N-terminal amino 15N resonance of Gly1 with the HACAN CH2-TROSY experiment. (A) Superimposed small regions of 1H/15N cross sections taken through the 3D CH2-TROSY HACAN spectrum of HAfp23, showing the correlation between the Gly1 1Hα2/1Hα3 and amino 15N chemical shifts. (B) The Gly1 backbone amino 15N (black) and 13Cα (red) chemical shift dependence on pH is shown. A non-linear least-squares regression was used to fit the Henderson-Hasselbalch equation to the titration curves. The fitted values are: pK = 8.73±0.07, 15N and 13Cα chemical shifts of 27.0±0.6. ppm and 44.3±0.1 ppm, respectively, for the protonated form (NH3+), and 13.6±0.4 ppm and 46.8±0.1 ppm, respectively, for the deprotonated form (NH2). The fitted pK value when measuring the Gly1 13C′ shift on a separate sample (Fig. 2) is 8.84±0.05.

