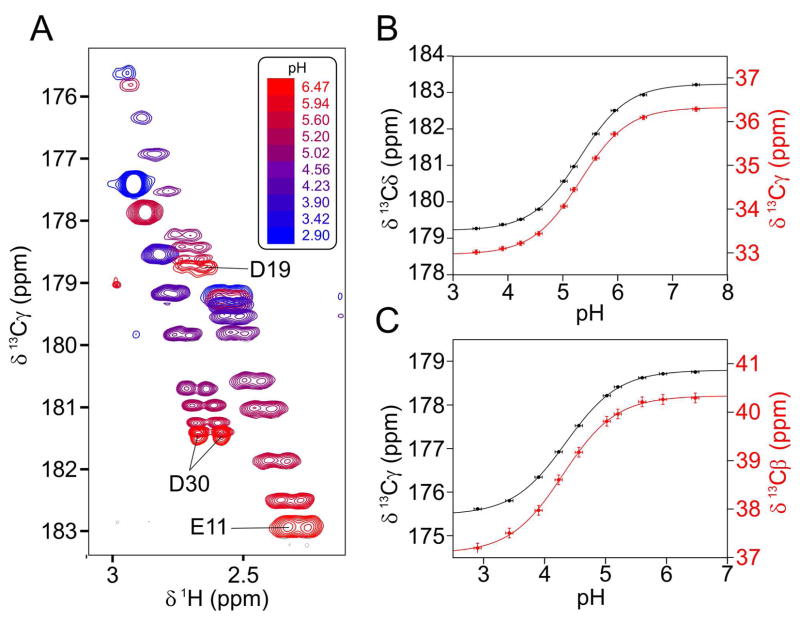
Figure 3.
Chemical shift titrations of the carboxylate groups of Glu11 and Asp19. (A) Superimposed small regions of cross sections taken through the 3D HCCO spectra taken over the range from pH 6.5 to 2.9, showing the correlation between the carboxylic acid 13C and its vicinal methylene 1H chemical shifts. Chemical shift versus pH for (B) the Glu11 side chain 13Cδ (black) and 13Cγ (red), and (C) the Asp19 side chain 13Cγ (black) and 13Cβ (red) are fit to the Henderson-Hasselbalch equation using non-linear least-squares regression. Fitted values for (B) are: pK = 5.31±0.01, with 13Cδ and 13Cγ chemical shift of 179.2 ppm and 33.0 ppm, respectively, for the protonated form (COOH), and a 13Cδ and 13Cγ chemical shift of 183.2 ppm and 36.3 ppm for the deprotonated form (COO−). Fitted values for Asp19 are: pK = 4.35±0.02, with 13Cγ and 13Cβ chemical shift of 175.5 ppm and 37.1 ppm, respectively, for the protonated form, and 13Cγ and 13Cβ chemical shifts of 178.8 ppm and 40.3 ppm for the deprotonated form (COO−).

