
Table 1.
Analogue Inhibition of Monoamine Uptake and Nicotinic Acetylcholine Receptor (nAChR) Function
 | ||||||||||
|---|---|---|---|---|---|---|---|---|---|---|
| Compd | R1 | R2 | X | Monoamine Uptake Inhibitiona IC50 (nM) |
nAChR Inhibitionb IC50 (µM) |
|||||
| [3H]DA | [3H]NE | [3H]5HT | α3β4*- | α4β2- | α4β4- | α1*- | ||||
| 2c | 660 ± 180 | 1900 ± 300 | IA | 1.8 (1.15) | 12 (1.15) | 15 (1.07) | 7.9 (1.12) | |||
| (S,S)-4ac | 630 ± 50 | 180 ± 4 | IA | 11 (1.48) | 3.3 (1.07) | 30 (1.10) | 28 (1.45) | |||
| (R,R)-4ac | IA | 9900 ± 1400 | IA | 6.5 (1.20) | 31 (1.12) | 41 (1.07) | 7.5 (1.10) | |||
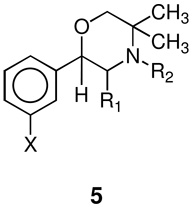
| (S,S)-5a | CH3 | H | Cl | 220 ± 60 | 100 ± 30 | 387 ± 140 | 3.3 ± | 20 (0.06) | 30 (1.12) | NT |
| (R,R)-5a | CH3 | H | Cl | 1600 ± 270 | 1200 ± 300 | IA | 1.6 (1.07) | 17 (1.06) | 12 (1.06) | 9.4 (1.05) |
| (S,S)-5b | CH3 | H | F | 61 ± 20 | 32 ± 3 | 4600 ± 430 | 5.6 (1.04) | 23 (1.05) | 55 (1.10) | 34 (1.07) |
| (S,S)-5c | CH3 | H | Br | 44 ± 3 | 150 ± 20 | 390 ± 30 | 1.4 (1.12) | 12 (1.06) | 11 (1.07) | 7.3 (1.07) |
| (S,S)-5d | CH3 | CH3 | Cl | 230 ± 60 | 170 ± 20 | 540 ± 130 | 2.8 (1.09) | 16 (1.14) | 23 (1.09) | 21 (1.05) |
| (S,S)-5e | CH3 | C2H5 | Cl | 44 ± 9 | 24 ± 8 | 1500 ± 300 | 0.79 (1.06) | 7.2 (1.06) | 6.4 (1.04) | 14 (1.05) |
| (S,S)-5f | CH3 | C3H7 | Cl | 61 ± 20 | 13 ± 3.6 | 2900 ± 400 | 0.98 (1.06) | 12 (1.06) | 5.8 (1.04) | 5.5 (1.06) |
| (S,S)-5g | C2H5 | H | Cl | 23 ± 5 | 19 ± 3 | 1800 ± 30 | 5.6 (1.16) | 14 (1.05) | 15 (1.10) | 13 (1.07) |
| (S,S)-5h | C3H7 | H | Cl | 6.0 ± 1 | 9 ± 2 | 300 ± 100 | 3.1 (1.15) | 9.5 (1.04) | 8.0 (1.12) | 5.0 (1.08) |
Values for mean ± standard error of three independent experiments, each conducted with triplicate determination.
Mean micromolar IC50 values (to two significant digits) for (S,S)- and (R,R)-hydroxybupropions (4a and 4b) and the indicated 2-(substituted phenyl)-3,5,5-trimethylmorpholine analogues from three independent experiments for inhibition of functional responses to an EC80–EC90 concentration of carbamylcholine mediated by nAChR subtypes composed of the indicated subunits (where * indicates that additional subunits are or may be additional assembly partners with the subunits specified; see Methods and Materials). Numbers in parentheses indicate S.E.M. as a multiplication/division factor of the mean micromolar IC50 values shown [i.e., the value 1.8 (1.15) reflects a mean IC50 value of 1.8 µM with an S.E.M. range of 1.8 × 1.15 µM to 1.8/1.15 µM or 1.6–2.1 µM]. IA: IC50 >100 µM. NT: not determined.
Taken from reference 13.