
Figure 1. Maximum percent reduction or best response of target lesions in patients (N=34) with available post baseline tumor measurements.
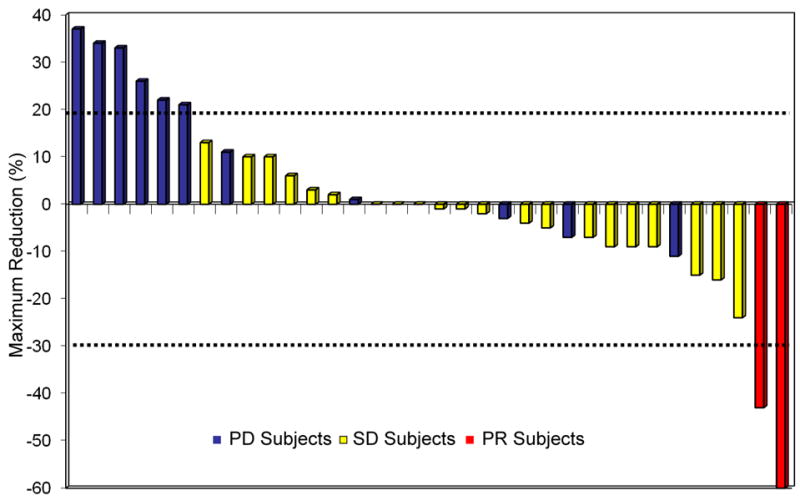
PD, progressive disease; SD, stable disease; PR, partial responses. Two PRs measuring 60% and 43% and 20 patients (59%) with stable disease with a median duration of 5.4 months. Tumor shrinkage (1% to 24%) was seen in 12 patients with stable disease and tumor growth (2% to 16%) was seen in the remaining 8 patients. In total 8 patients (24%) had stable disease ≥ 6 months, with 3 patients on study for 6 months, 1 for 7 months, 2 for 8 months, 1 for 10 months and 1 patient for 17 months respectively. Progressive disease as best response was seen in 12 patients (35%), with 3 patients considered not evaluable.