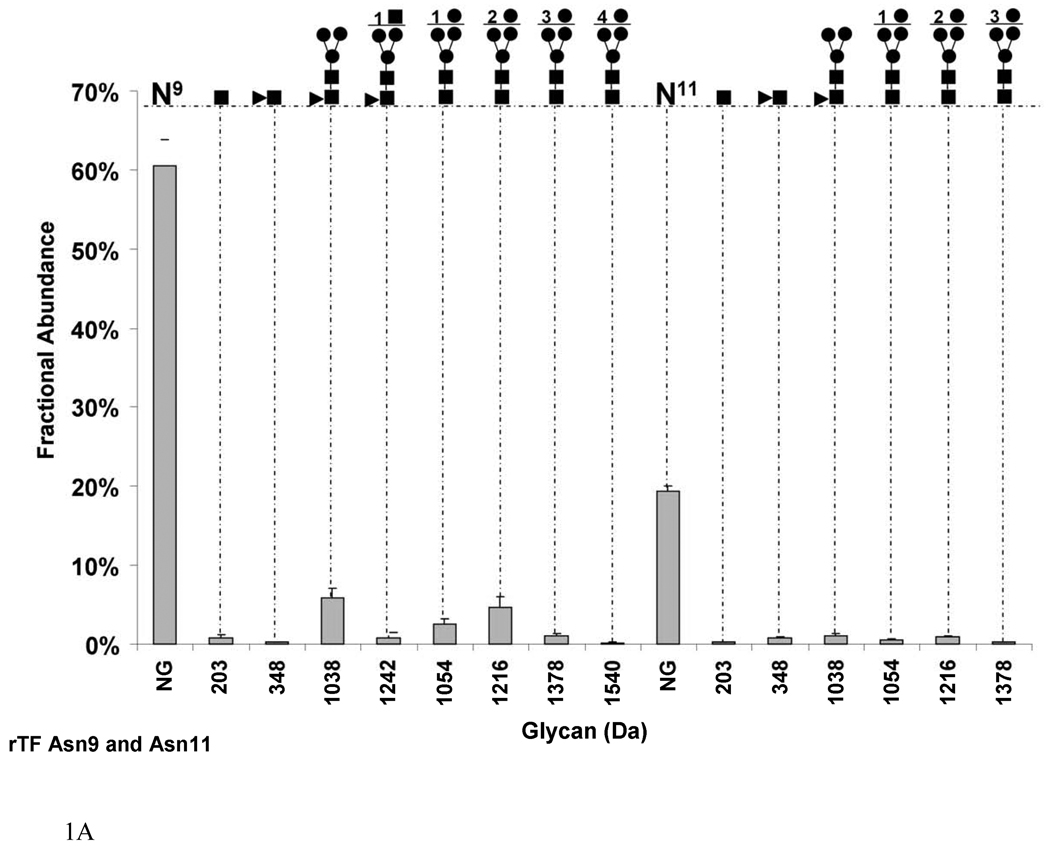
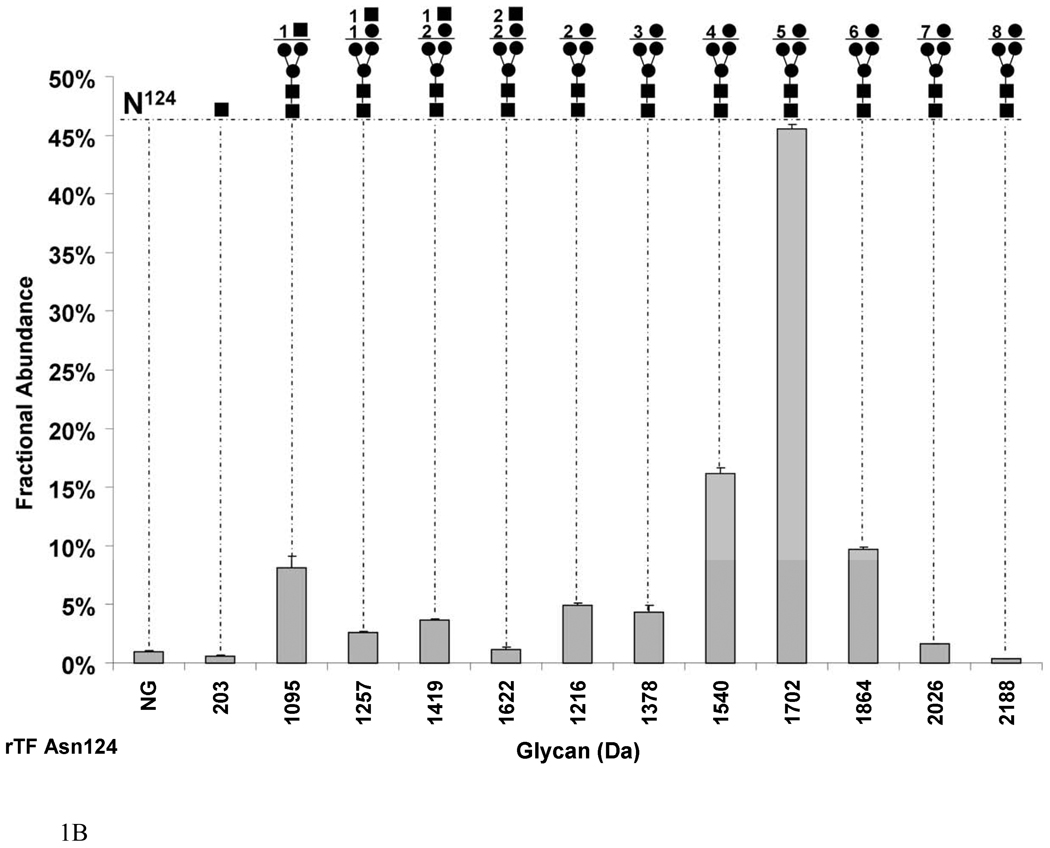
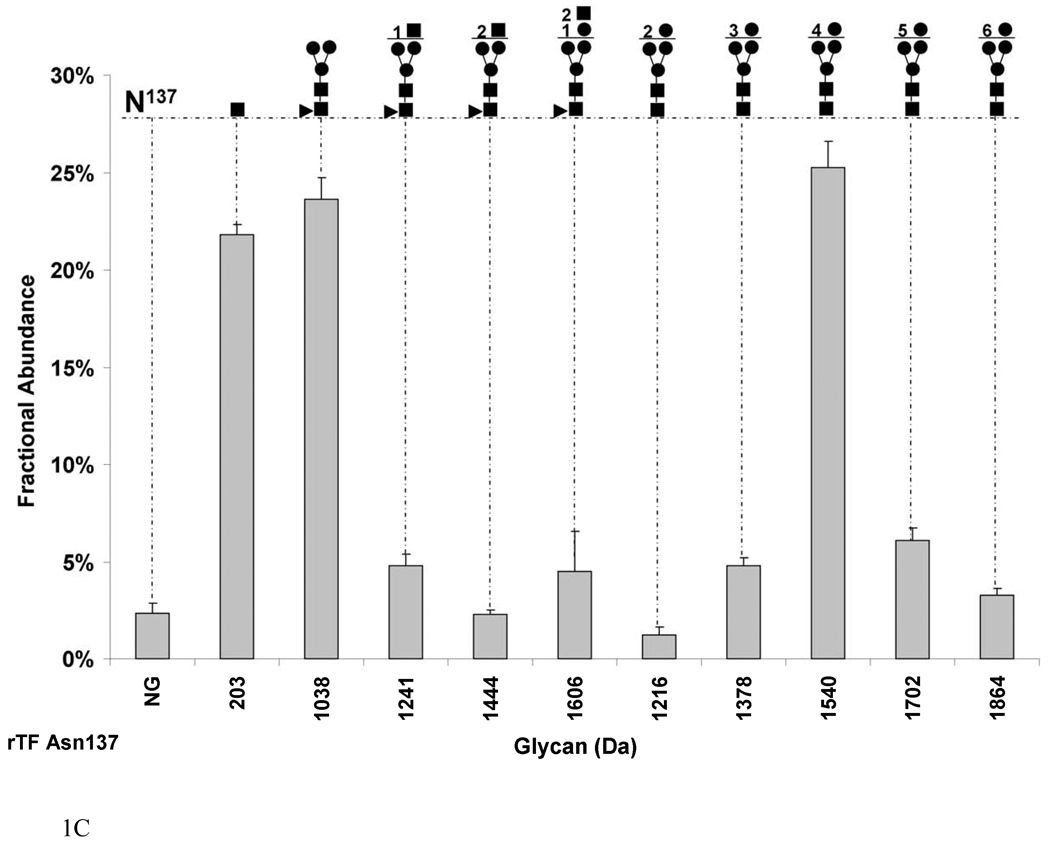
Fig. 1.
Graphs showing the fractional abundances of the non-glycosylated (NG) and glycosylated peptides versus glycan mass for the three N-glycosylation sites on rTF: (a) Asn9 and Asn11 (truncated protein and full-length protein, respectively), (b) Asn124 and (c) Asn137. One standard deviation of the mean of three measurements is shown as an error bar for each fractional abundance. The figures above the graph define the glycan composition where the symbol (●) represents Man/Hex, (■) represents GlcNAc/HexNAc and (▲) represents Fuc. The numerical coefficients in front of each symbol designate the number of molecules of each sugar in the glycan beyond the core.


