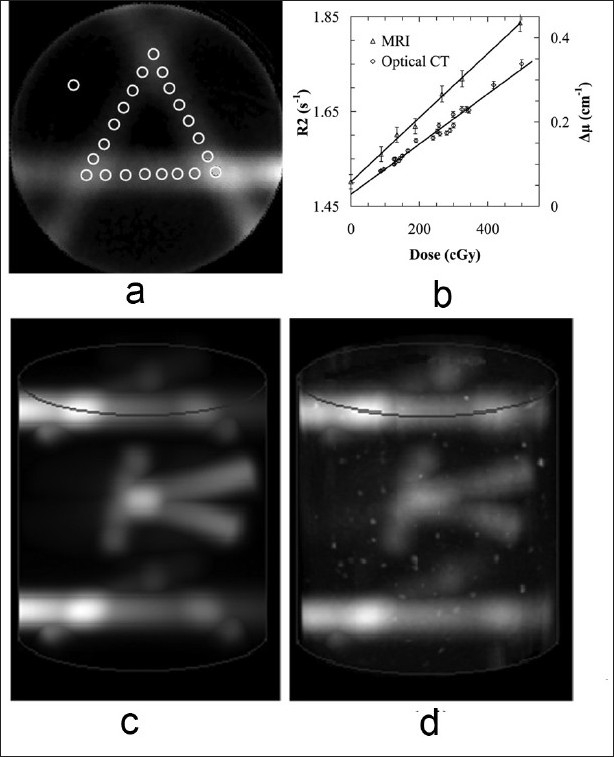
Figure 2.

NIPAM gel dosimeters prepared according to procedure A were irradiated using (a) a standard pencil beam “A” pattern. (b) A calibration curve is obtained by registering and correlating well-determined points on the plan and optical CT slice. (c) A volume image of a treatment plan containing two calibration “A” patterns and one measurement “K” pattern, and (d) the corresponding NIPAM gel dosimeter-measured optical CT image.
