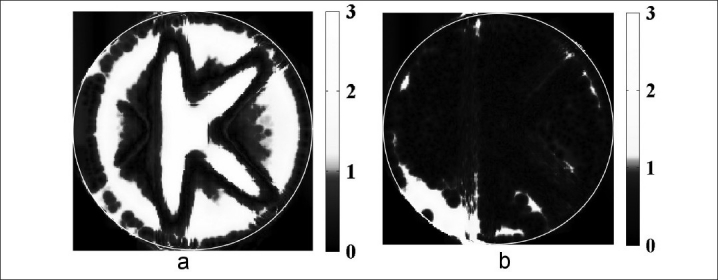
Figure 3.

The central slice of a 500 cGy “K” treatment plan delivered to the 6 %T NIPAM gel dosimeter prepared according to procedure A was calibrated with the dose-to-attenuation relationship determined from the “A” pattern, and evaluated using a Low's gamma function analysis with 3% dose and 3 mm distance-to-agreement gamma function criteria. Two-dimensional gamma maps are shown comparing treatment plan dose to gel-measured dose obtained from (a) optical CT and (b) MR imaging
