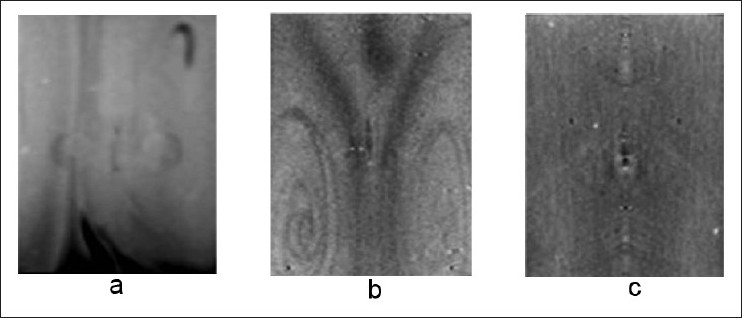
Figure 5.

Reconstructed image data showing the qualitative variation in dosimeter background attenuation with manufacture procedure. Both the (a) 6 %T and (b) 4 %T dosimeters can have significant irregularities in dosimeter background. These irregularities and the overall background opacity can be reduced as seen in (c) a 4 %T dosimeter produced by a modified preparation method. The central axis artifacts seen in (c) are not features in the dosimeter but are related to other stray light effects from scanner imaging. The slice in (c) is windowed at a significantly higher level of contrast than (a) and (b) to show these artifacts.
