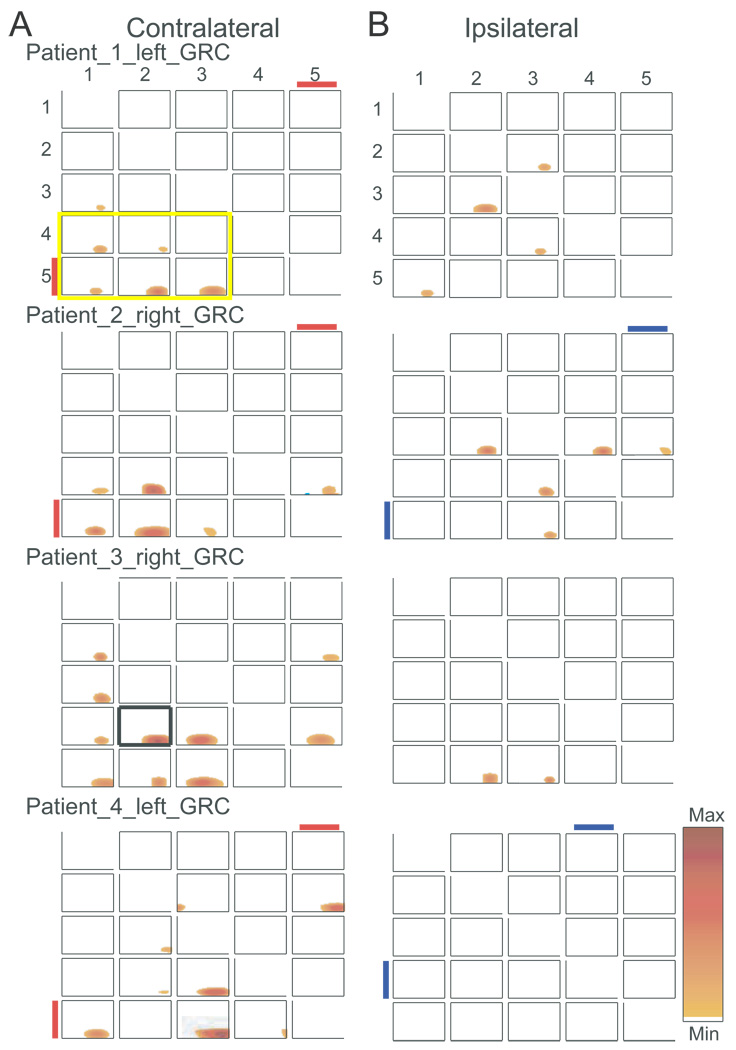
Figure 2.
Time frequency plots of GRC for all patients studied, where each row indicates results contralateral and ipsilateral to the stimulus, as labeled. For each patient the side of the recording is indicated for each patient on the contralateral side in A. The red or blue lines under the contact number indicate the presence of a reproducible LEP in response to a contralateral or ipsilateral laser stimulus. The time frequency plot in Figure 1A is shown in 2B with a heavy margin around the plot in patient 3, left grid.

