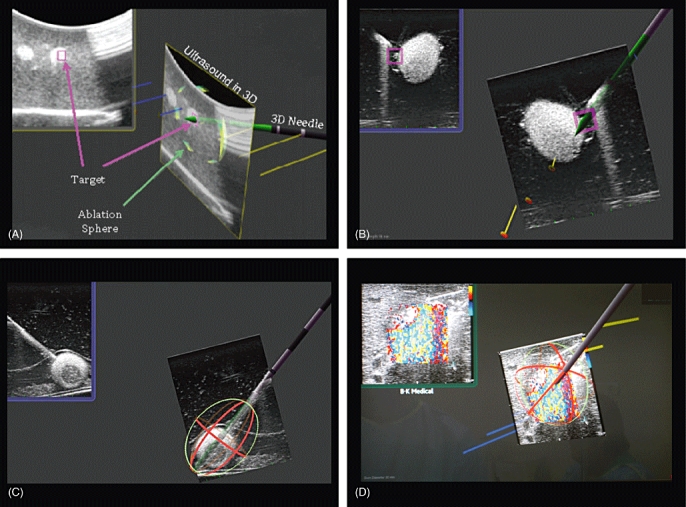
Figure 2.

Representative screen shots taken from the monitor demonstrating in 3-D the 2-D ultrasound (US) image, virtual ablation antenna and predicted antenna tract. (A, B) Representative screen shots of tumour targeting. (C) Representative screen shot of a phantom tumour in an experimental pig model showing the 3-D representation of the predicted ablation zone. (D) Photograph of monitor displaying imaging performed during microwave ablation (MWA) of a hepatic tumour in the human MWA study, showing 3-D representation of the predicted ablation zone
