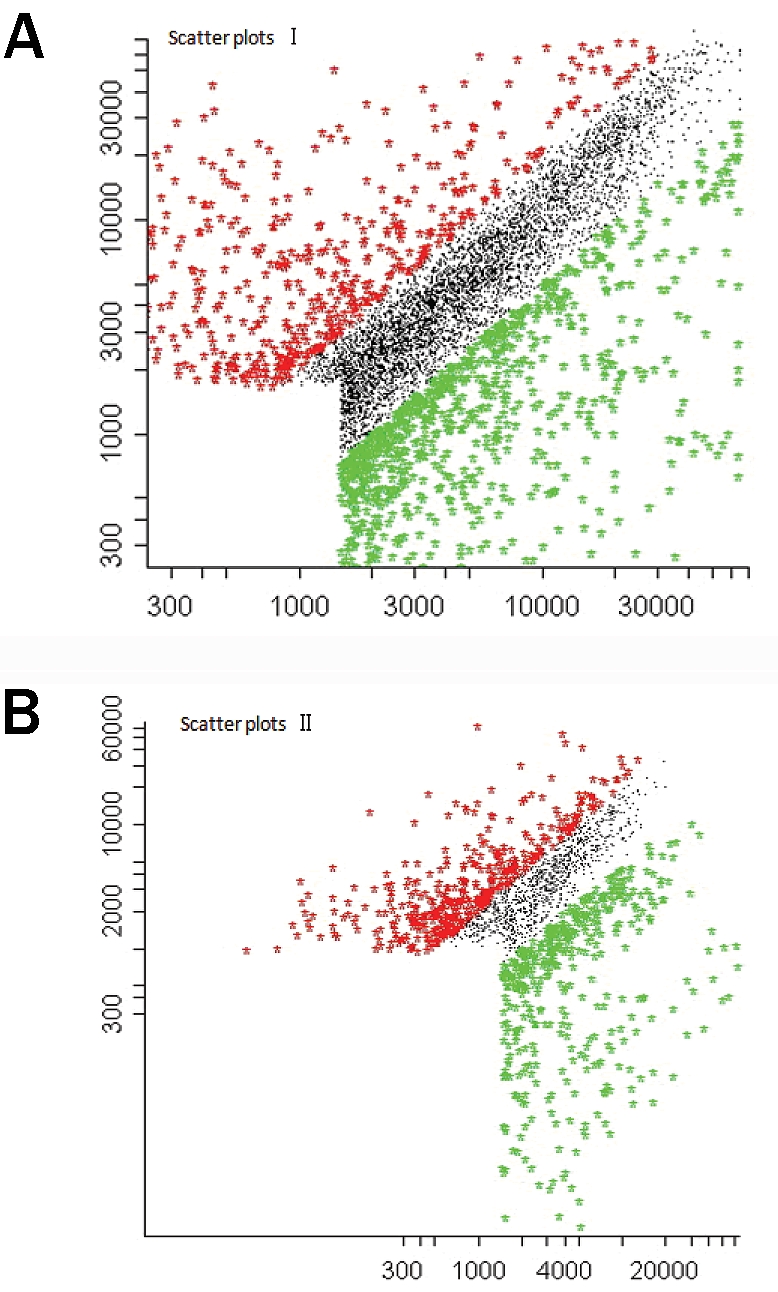
Figure 3.

Scatter plots I: gene chip hybridization of MSCs and elastic chondrocytes (x-axis represents the signal value of elastic chondrocytes, and y-axis represents the signal value of MSCs). B. Scatter plots II: gene chip hybridization of MSCs and hyaline chondrocytes (x-axis represents the signal value of hyaline chondrocytes, and y-axis represents the signal value of MSCs). In both scatter plots, the green dots show the up-regulated genes, the red dots show the down-regulated genes and the black dots show the genes were not differentially expressed.
