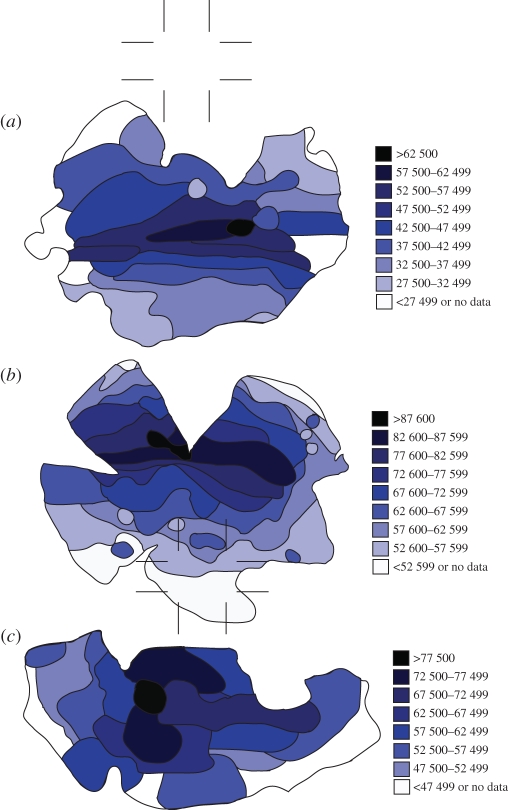
Figure 3.
The retinal topography of each of the three species in this study: (a) S. plangon and (b) O. cyanea show a prominent, horizontally orientated band of increased photoreceptor density across the horizontal equator of the retina; (c) S. lessoniana shows a more centrally positioned area of increased photoreceptor density. Densities peak at over 87 600 cells mm−2 in O. cyanea. In each case, there were areas of retina (mostly in the periphery) where no cell counts could be taken owing to damaged tissue; however, the tissues approaching these areas give an indication of most probable density.

