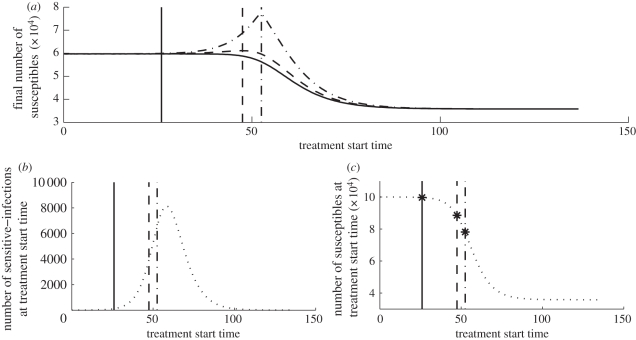
Figure 2.
Effect of treatment start time on total attack rate (situation 1B). The vertical lines indicate the optimal treatment start time τ* for a large κ (solid line), an intermediate κ (dashed line) and a small κ (dotted-dashed line). (a) The final number of susceptibles as a function of treatment start time for a large κ (κ = 0.58; solid curve), an intermediate κ (κ = 0.4; dashed curve) and a small κ (κ = 0.001; dotted-dashed curve). (b) The number of sensitive infections as a function of treatment start time, τ. The total attack rate is decreased by decreasing the number of sensitive infections at the treatment start time (I(τ)) and by decreasing the number of susceptibles at the treatment start time (S(τ)) (equation (3.7)). As κ increases, the effect of decreasing I(τ) becomes more important than decreasing S(τ); therefore, τ* decreases as κ increases (from left to right, the order of the vertical lines is solid, dashed and dot-dashed). (c) The number of susceptibles as a function of treatment start time. As κ increases, S(τ*) increases. Also, the points S = Smin are indicated by ‘star’ markers and coincide with S(τ*). Parameters are RI = 1.6, RR = 0.8RI and μI = μR = 1/3.3.

