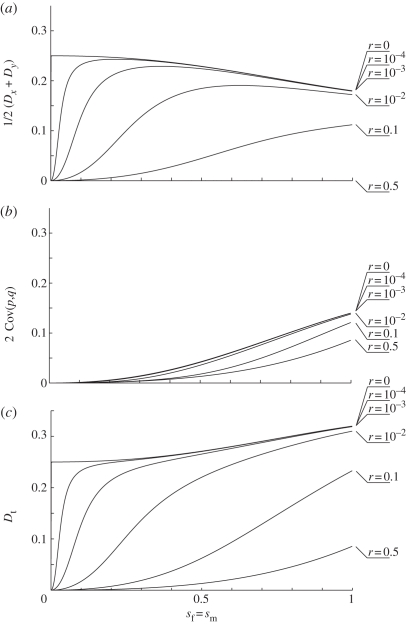
Figure 4.
Linkage disequilibrium and its components as a function of selection strength for the particular case in which sm = sf. Each line represents the stable LD for different recombination rate values, indicated next to the line to the right of each figure. The axes in each plot are the selection coefficient sm = sf (x-axis) and the LD or its component (y-axis). The first row (a) corresponds to the average LD in gametes 1/2 (Dx + Dy). The second row (b) corresponds to the covariance between allele frequencies. The third row (c) corresponds to the total LD, Dt, in zygotes.

