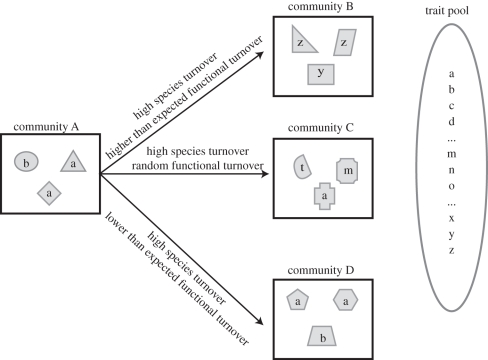
Figure 1.
A cartoon depicting the species and functional turnover between a set of four hypothetical communities. The shapes indicate species identity and the letters indicate the functional strategy of the species. The trait pool represents all of the functional strategies that could potentially colonize a community. Community A shares no species in common with any of the other communities and it therefore has the same level of species turnover from A to B, A to C and A to D. Community A and community B share no functional strategies. Further, the strategies present in community B are significantly more dissimilar from those in community A than expected if one were to randomly pull three strategies from trait pool. This would be expected if an underlying environmental gradient determines species turnover and community assembly. Community A and community C share no functional strategies, but the functional turnover is indistinguishable from a random pull of three functional strategies from the trait pool. This would be expected under a stochastic model of species turnover and community assembly. Community A and community D are functionally analogous and there is less functional turnover than expected given a random pull of three strategies from the trait pool. This would be expected where dispersal is limited but community assembly is deterministic with respect to the environment. The figure illustrates that three different ecological processes can be determined by examining the functional and species turnover between communities simultaneously, while analyses of species turnover alone could provide erroneous ecological inferences.

