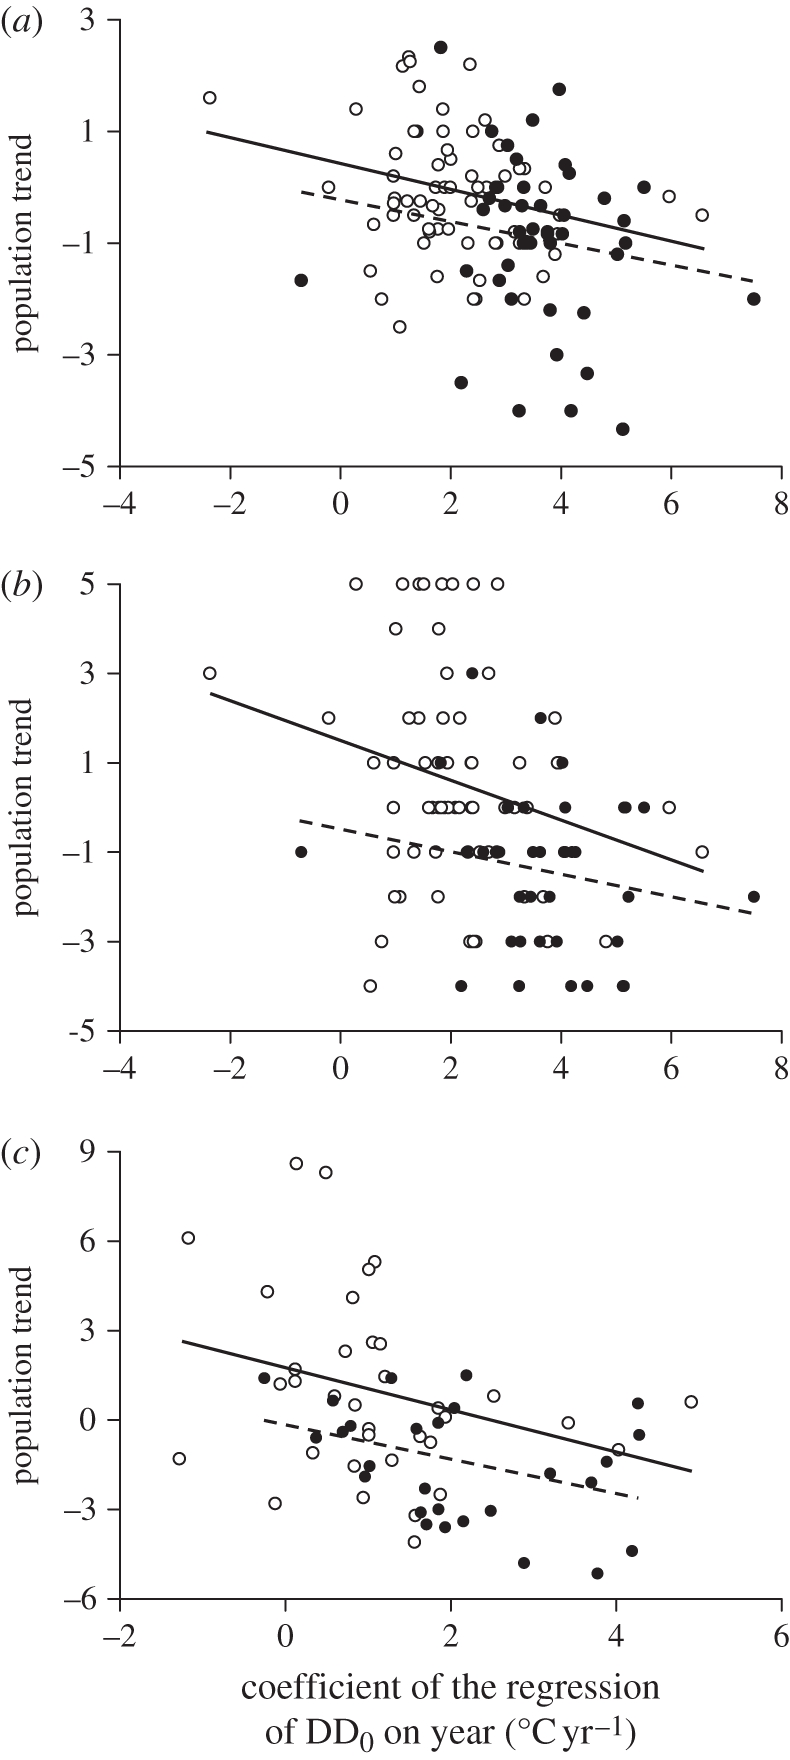
Figure 4.

Population trends in relation to thermal delay. (a) Mean species population trends [34] in the seven countries in relation to species DD0Yr. (b) Population trends in Finland [34] in relation to species DD0Yr computed for the Finnish sites (Jurmo and Hanko). (c) Population trends in Finland obtained from a different source [35] in 1983–2005 in relation to species DD0Yr calculated over the same period for the Finnish sites. Regression lines fitted to short-distance (empty circles, solid line) or long-distance (filled circles, dashed line) migrants show that the slopes are similar.
