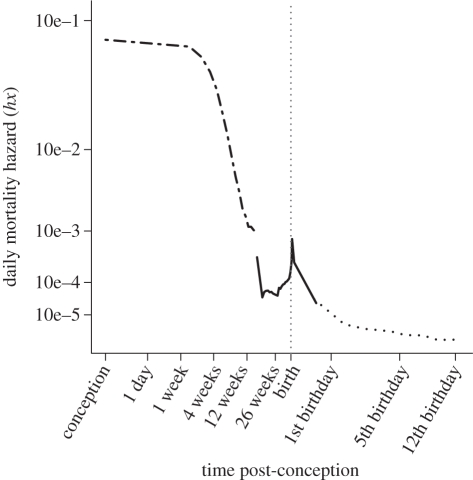
Figure 1.
Mortality hazard from conception to 12th birthday. Estimated mortality hazard from conception to 12th birthday for a composite of human populations. Both axes are root transformed for graphical convenience. The dotted grey line demarks the transition from foetal to infant mortality. Mortality hazard drops sharply with in utero development, beginning to rise around 26 weeks and reaching a local maximum with the number of deliveries. Mortality declines nearly monotonically for 12 years thereafter. Data are from three sources: foetal data from rural Bangladesh (dashed–dotted line [28]), late foetal and infant data from Norway 1967–1973 (solid line [90]) and childhood mortality data from Norway 1970 (dashed line [91]). A population effect can be seen in these data, but it is strongly outweighed by the age effect.

