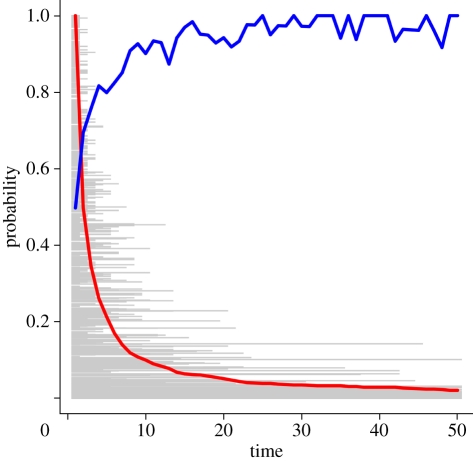
Figure 2.
Simulated frailty-based ontogenescence. A simple simulation demonstrates how heterogeneous frailties can cause ontogenescence. The height of each grey line is the frailty of one individual, and the termination of that line is its age at death. Each of 1000 simulated individuals has a unique but time-constant frailty. As the frailer individuals die out, the proportion of survivors (lx, red line) decreases, and the mean probability of remaining individuals surviving through the period (px, blue line) increases.

