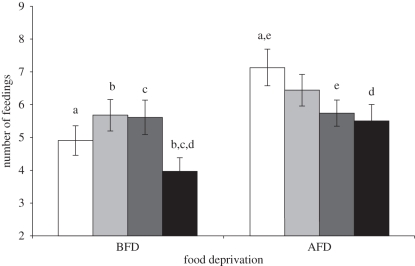
Figure 1.
Mean (±s.e.) number of feedings received by each nestling in AFD and BFD trials according to individual sex and seniority. Significant differences in seniority × sex × feeding trial at post hoc tests are indicated by the same letter. White bars, junior males; light grey bars, junior females; dark grey bars, senior males; black bars, senior females.

