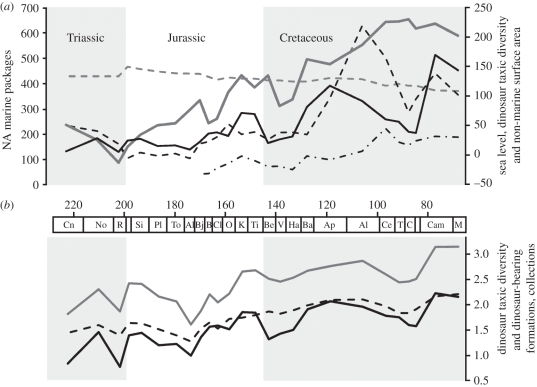
Figure 1.
Raw data series plotted against geological time. (a) Number of marine gap-bound sedimentary packages within North America (black dashed line; left y-axis shows number of packages), Haq et al. (solid grey line) and Miller et al. (dotted-dashed line) sea-level curves (right y-axis shows metres below or above present day sea level), species level dinosaur taxic diversity (solid black line; right y-axis shows numbers of valid species), and non-marine surface area (grey dashed line; right y-axis shows area in 106 km2). (b) Species-level dinosaur taxic diversity (solid black line), number of dinosaur-bearing formations (dashed line) and number of dinosaur-bearing collections (solid grey line). Data series in (b) are log10 transformed.

