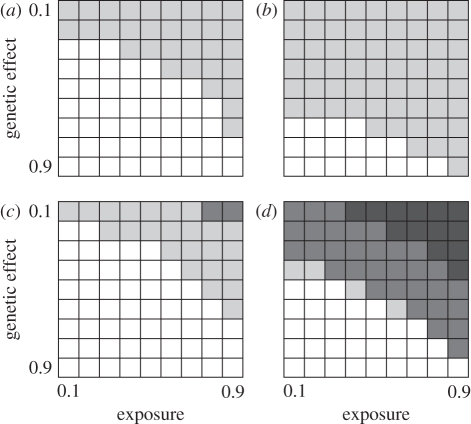
Figure 1.
How the probability of finding a significant genotype–phenotype association for an infectious disease varies with marker type, exposure rate, recombination rate and size of genetic effect. Each cell contains the proportion of approximately 100 replicate simulations that yielded an experiment-wide significant association at α = 5%. Greyscale represents: white = 0–5% significant; light grey = 5–50% significant; dark grey = 50–90% significant; black = 90–100% significant. Exposure is the proportion of individuals exposed to the disease, genetic effect is the probability of an exposed, genetically resistant individual catching the disease relative to an exposed, susceptible individual (p = 1). (a) ‘SNPs’ (=marker carries three genotypes), recombination rate = 10−3; (b) ‘SNPs’, recombination rate = 10−5; (c) ‘microsatellites’ (=marker carries 10+ genotypes), recombination rate = 10−3; (d) ‘microsatellites’, recombination rate = 10−5.

